
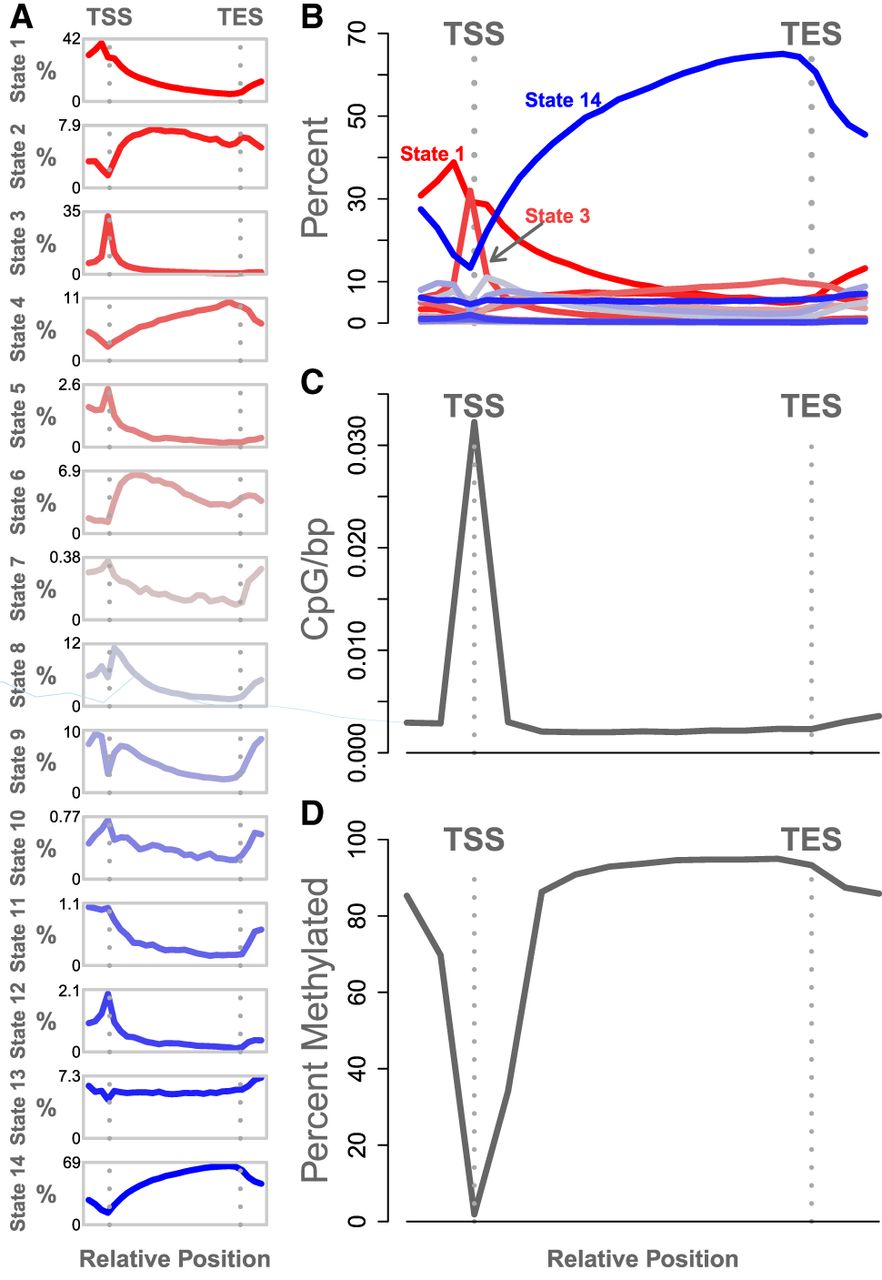
Relative abundance of chromatin states and methylated DNA. (A) Each panel shows the abundance of a single chromatin state relative to gene transcription start site (TSS) and transcription end site (TES). The y-axis in each panel is the percentage of genes containing the state. Each panel has an independent y-axis to better show the shape of each curve. The x-axis is the relative gene position. The TSS and TES are marked as vertical gray dotted lines. (B) The same data shown in panel A, but with all states overlaid onto a single set of axes to show the relative abundance of the states. (C) The density of CpG sites relative to the gene body. The y-axis shows the inverse inter-CpG distance in base pairs. The density is highest near the TSS. CpG sites are less dense within the gene body and in the intergenic space. (D) Percentage of methylation relative to the gene body. The y-axis shows the median percentage of methylation at CpG sites, and the x-axis shows relative gene position. CpG sites near the TSS are unmethylated relative to intragenic sites and to sites just upstream of and downstream from the gene bodies. In both C and D, standard error is shown as a blue envelope around the mean; however, the standard error is so small that it is not visible in the figure.


