
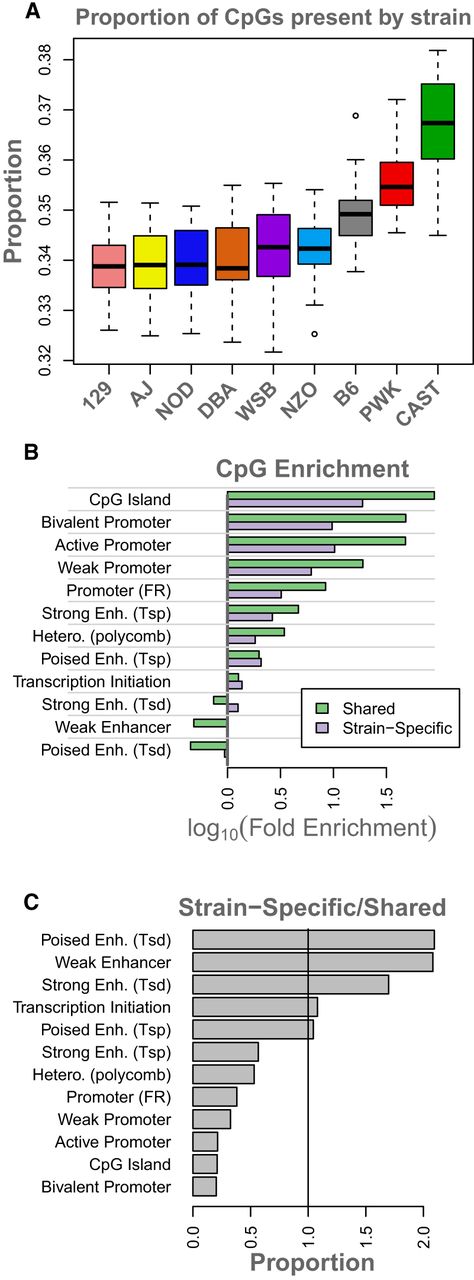
Overview of strain-specific CpG sites. (A) Boxes show the proportion of strain-specific CpG sites that is present in each strain. Boxes are colored by official strain colors for ease of visualization. Short names for strains are indicated below each box. (B) The log10 (fold enrichment) of CpG sites shared across all strains (green) and those that are strain specific (purple). (C) A comparison of enrichments between CpG sites that are shared across all strains and those that are strain specific. Bars above one show where strain-specific CpGs were more enriched than shared CpGs. Bars below one indicate where strain-specific CpGs were less enriched than shared CpGs. The vertical line marks where shared and strain-specific CpGs were equally enriched. Abbreviations are as follows: (FR) flanking region, (Tsp) transcription start site proximal, (Tsd) transcription start site distal, (Hetero.) heterochromatin, (Enh.) enhancer.


