
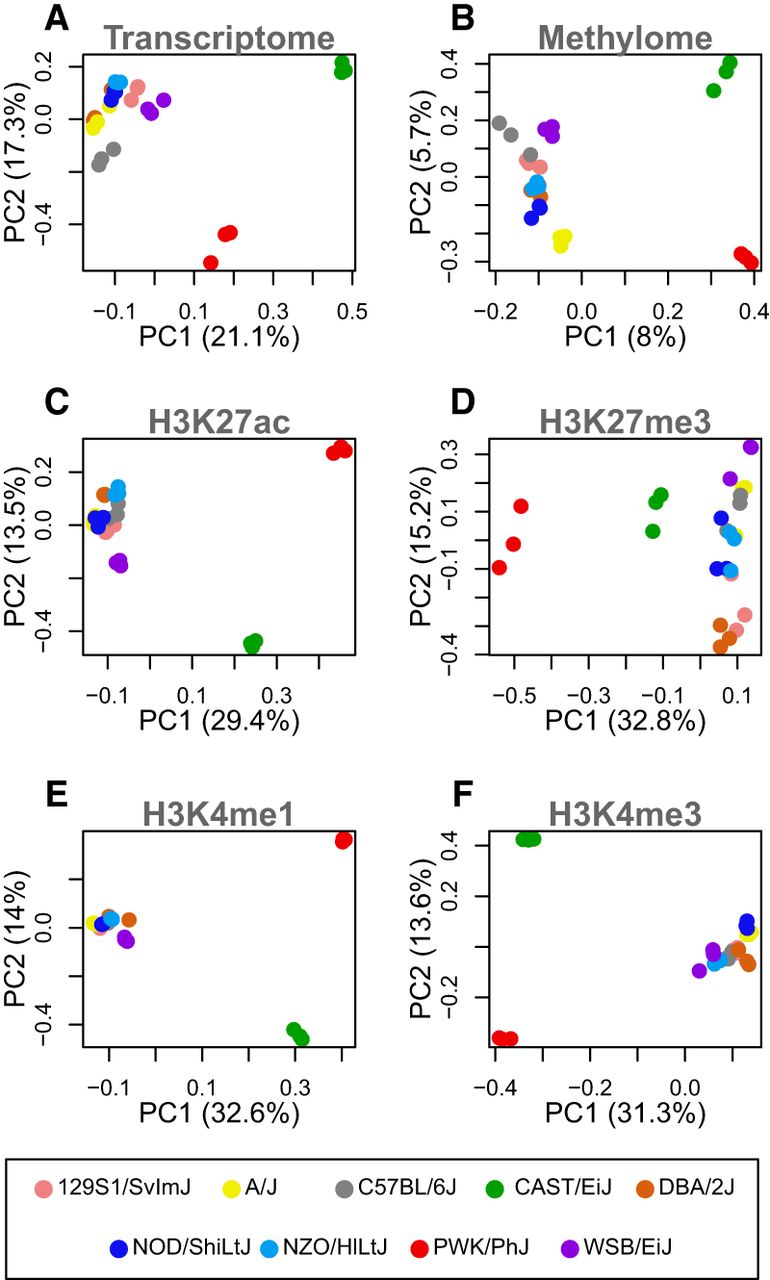
Figure 1.
The first two principal components of each genomic feature across nine inbred mouse strains. In all panels, each point represents an individual mouse, and strain is indicated by color as shown in the legend at the bottom of the figure. Three individuals per strain are shown. Each panel is labeled with the data used to generate the PC plot. (A) Hepatocyte transcriptome: all transcripts expressed in isolated hepatocytes. (B) DNA methylation: the percentage of methylation at all CpG sites shared across all individuals. (C–F) Histone modifications: the peak heights of the indicated histone modification for positions aligned across strains.


