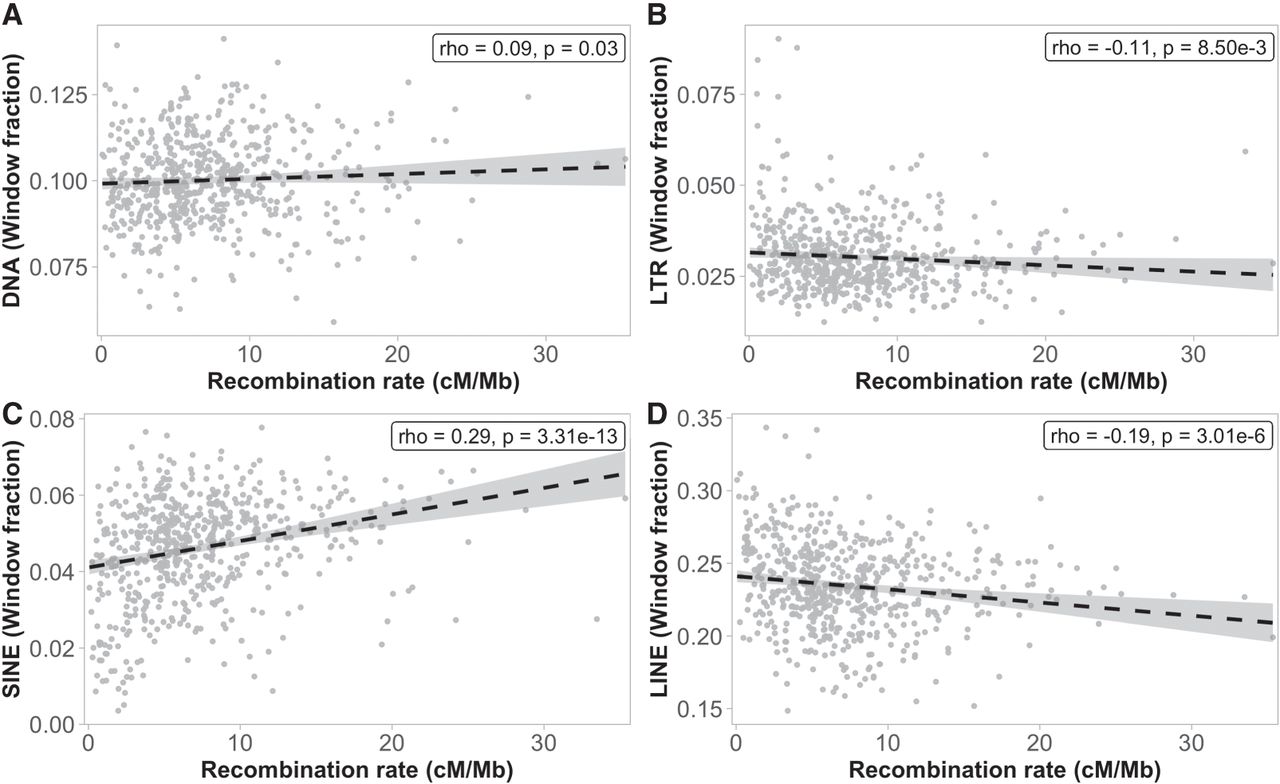
The fine-scale recombination rate variation and associations with genomic features in a butterfly

(Downloading may take up to 30 seconds. If the slide opens in your browser, select File -> Save As to save it.)

Click on image to view larger version.

Figure 7.
Figure 7.

Associations between the recombination rate (1-Mb scale) and the proportion of four different TE classes; (A) DNA transposons, (B) LTRs, (C) SINEs, and (D) LINEs. The abundance of TEs was calculated as the fraction of each 1-Mb window occupied by each specific element.

This Article

  1. Genome Res. 33: 810-823

Preprint Server