
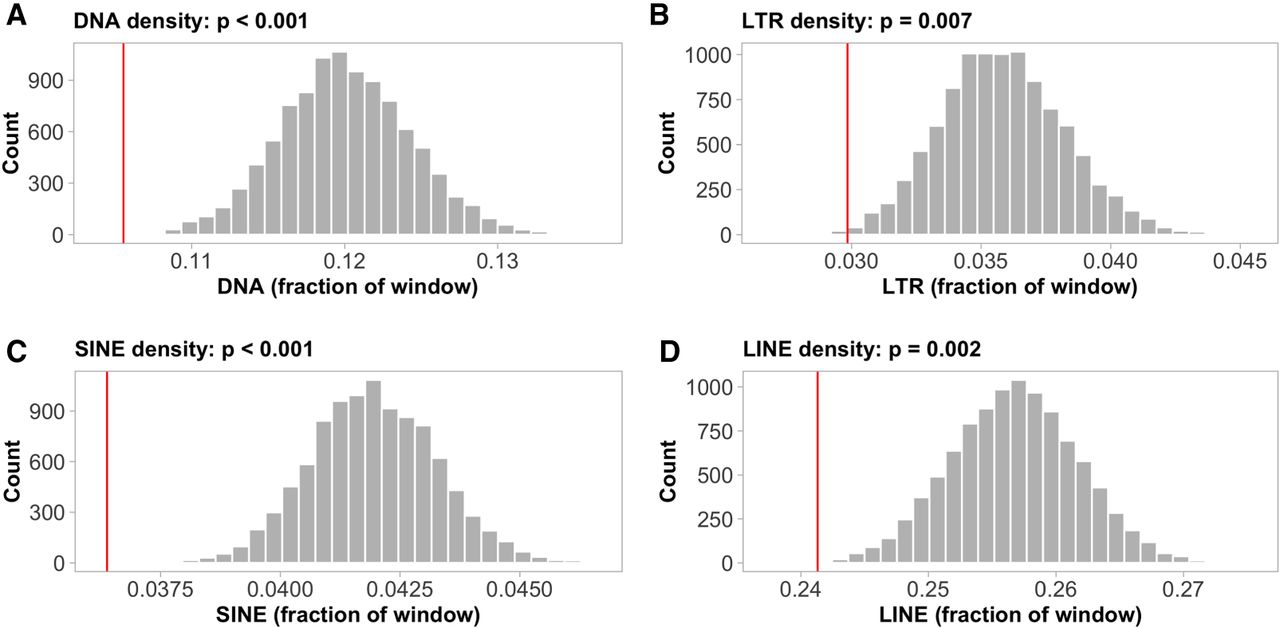
Figure 4.
Occurrence of transposable elements (TEs) in coldspots. The histograms show the density distributions of (A) DNA, (B) LTR, (C) SINE, (D) LINE, permuted means for 1283 random 30-kb genomic windows (number of, and average length of inferred coldspots). The red lines indicate the observed TE densities in the defined coldspot windows.


