
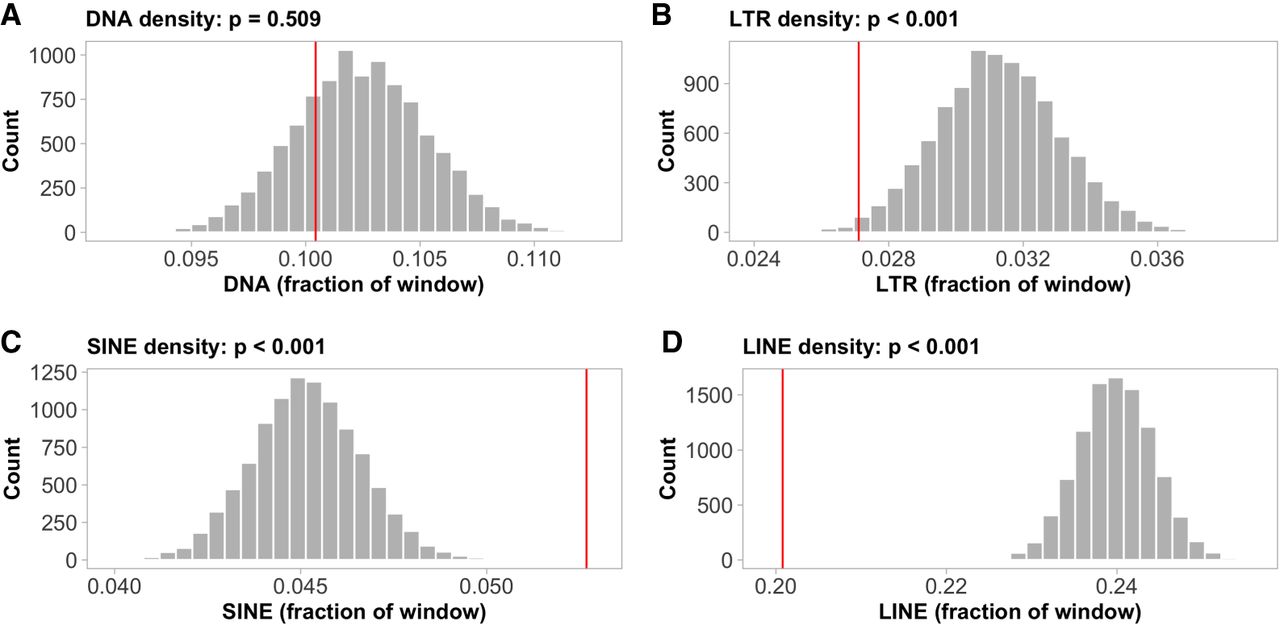
Figure 3.
Occurrence of transposable elements (TEs) in hotspots. The histograms show the density distributions of (A) DNA, (B) LTR, (C) SINE, (D) LINE, for 3124 randomly sampled 1656-bp genomic windows (number of, and average length of identified hotspots). The red lines indicate the observed mean TE densities in the defined hotspot regions.


