
Figure 1.
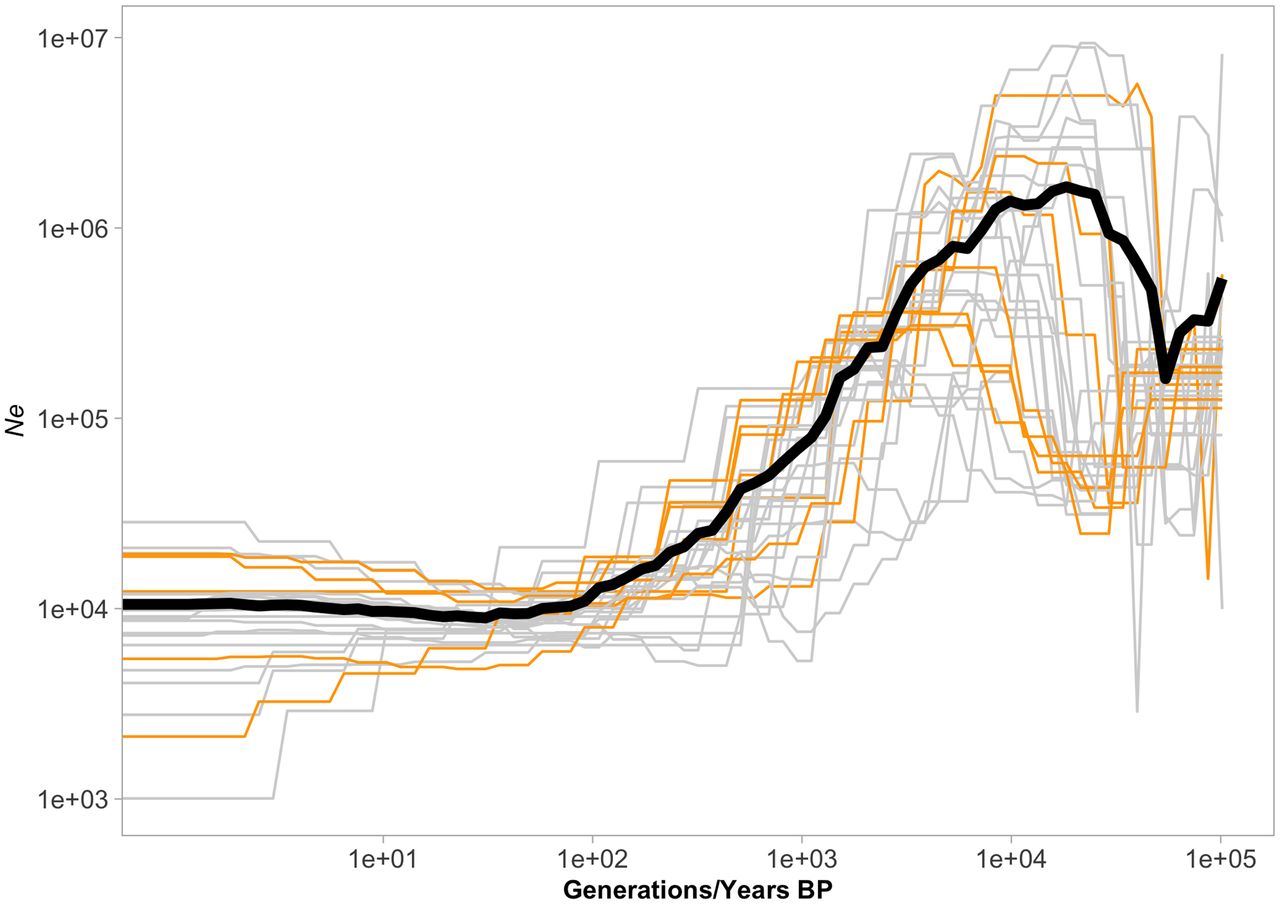
Demographic trajectories inferred for the different chromosomes in the Swedish population of the wood white. Six out of the ten individuals with the highest sequencing coverage were used to represent the entire geographic distribution. Only the 100,000 most-recent generations of the trajectories are shown, as all useful variation in Ne happens within that range. The number of generations is equivalent to the identical number of years only if we assume univoltinity over time. The black line indicates the mean Ne across chromosomes.


