
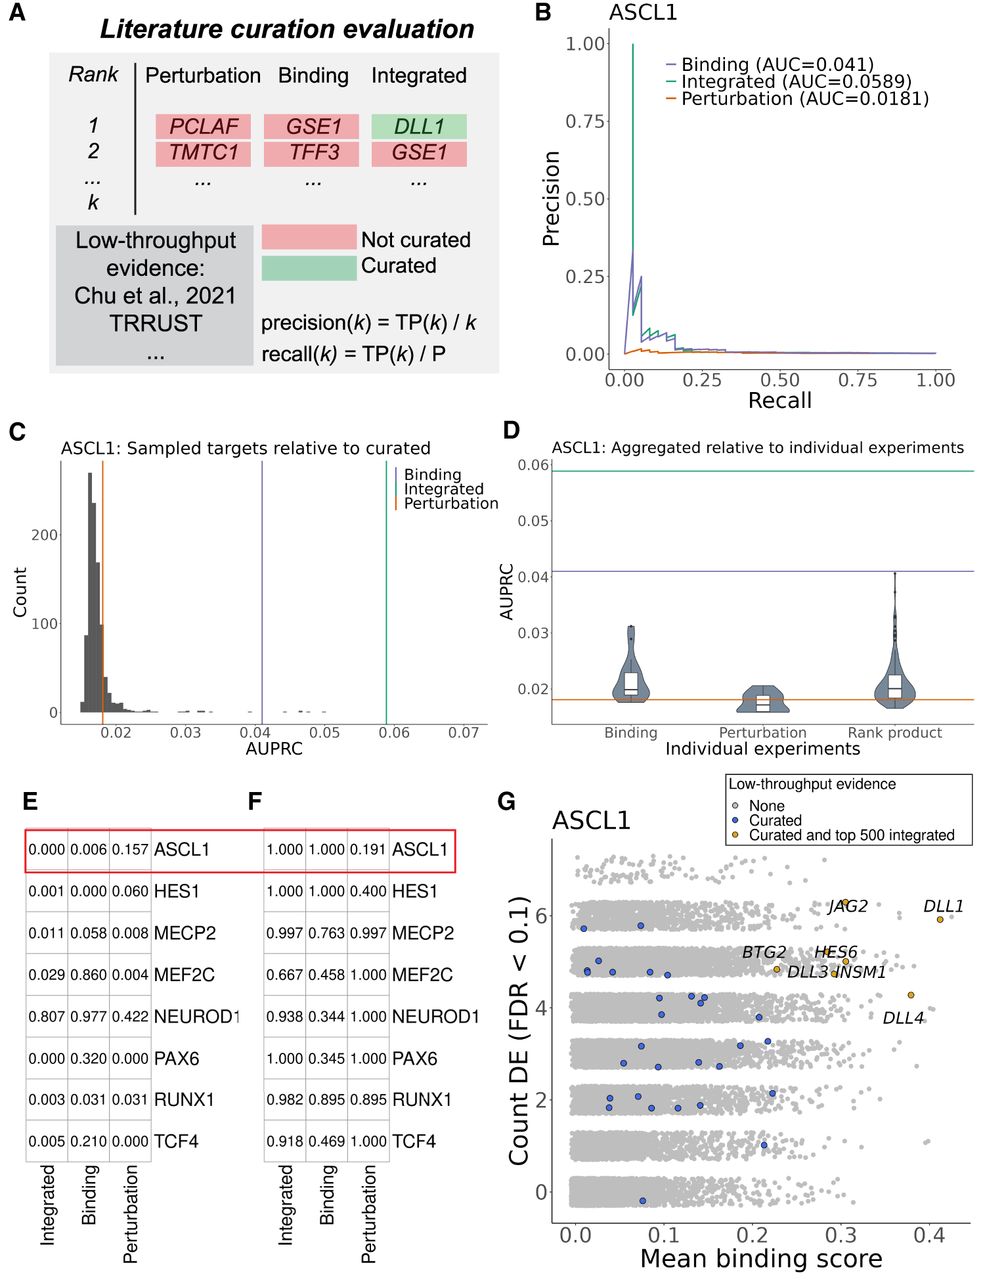
Overview of literature curation evaluation framework. (A) Precision and recall were calculated at every step (k) of the aggregated rankings for presence in the curated target resource. (TP) True positives called at step k, (P) all curated targets for the current TR. (B) PR curve and the associated areas under the curves (AUPRC) for human ASCL1. (C) The distribution of AUPRCs when sampling random targets from the curated resource and using the integrated ASCL1 ranking to calculate the AUPRC. Bars refer to the observed performance when using the curated ASCL1 targets. (D) Distribution of AUPRCs when using the individual ASCL1 experiments or their rank product pairings to order genes. (E) Proportion of samples in C whose AUPRC exceeded the observed values. (F) The percentile of the aggregate AUPRCs relative to the distribution of all individual comparisons in D. (G) Example of ASCL1 targets with genomics and low-throughput evidence.


