
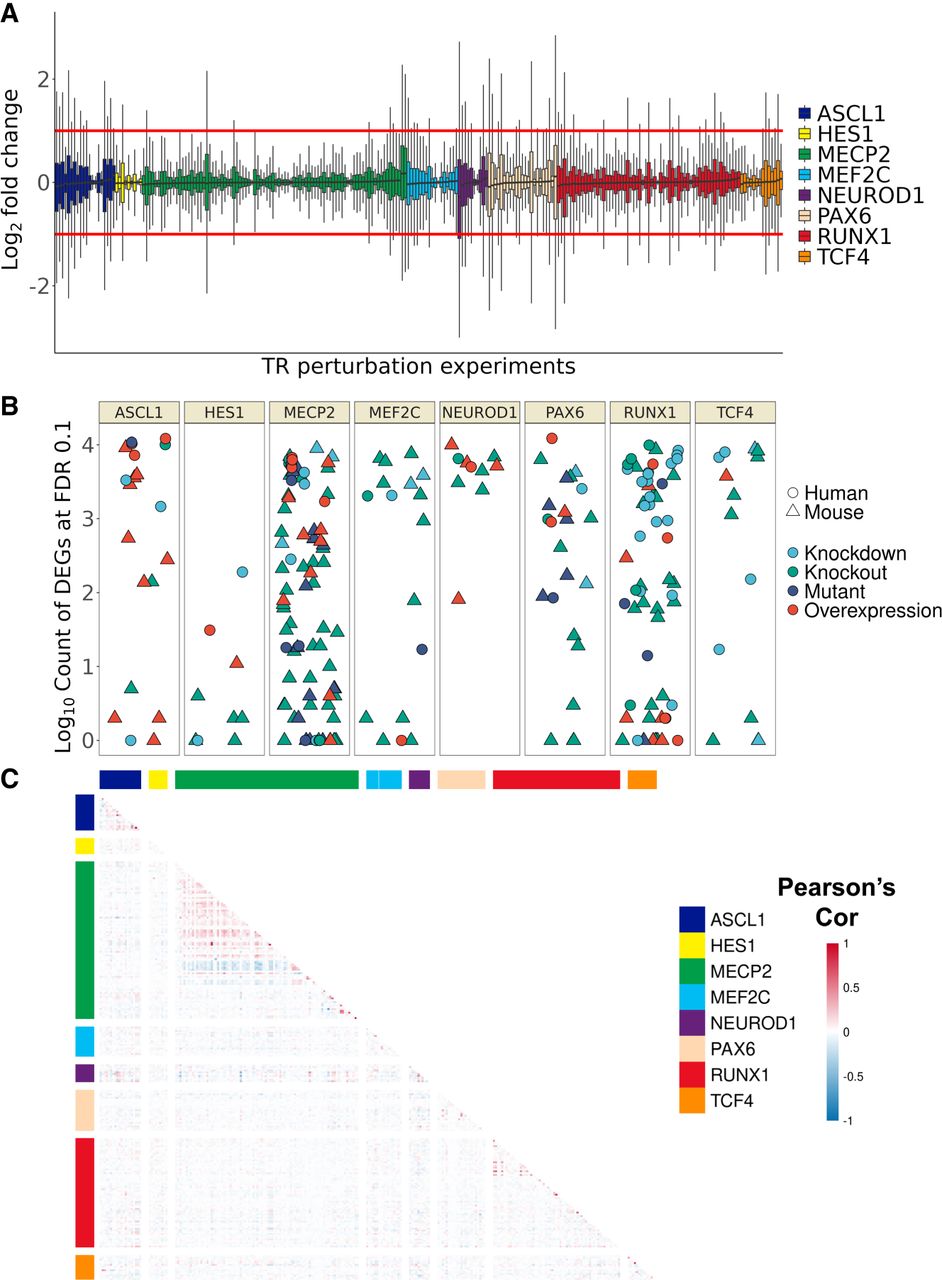
Figure 4.
Overview of TR perturbation experiments. (A) Distribution of gene log2 fold changes (FCs) across the 242 mouse and human perturbation experiments. FC was clipped at [−3, 3] for plotting. (B) Count (log10 scale) of differentially expressed genes grouped by TR; color denotes perturbation strategy, and shape denotes species. (C) Heatmap of correlation values of gene FC between experiments, grouped by TR. Note that only orthologous genes were calculated here to allow plotting of both species; the relatively minimal intra-TR correlation holds when considering mouse and human separately.


