
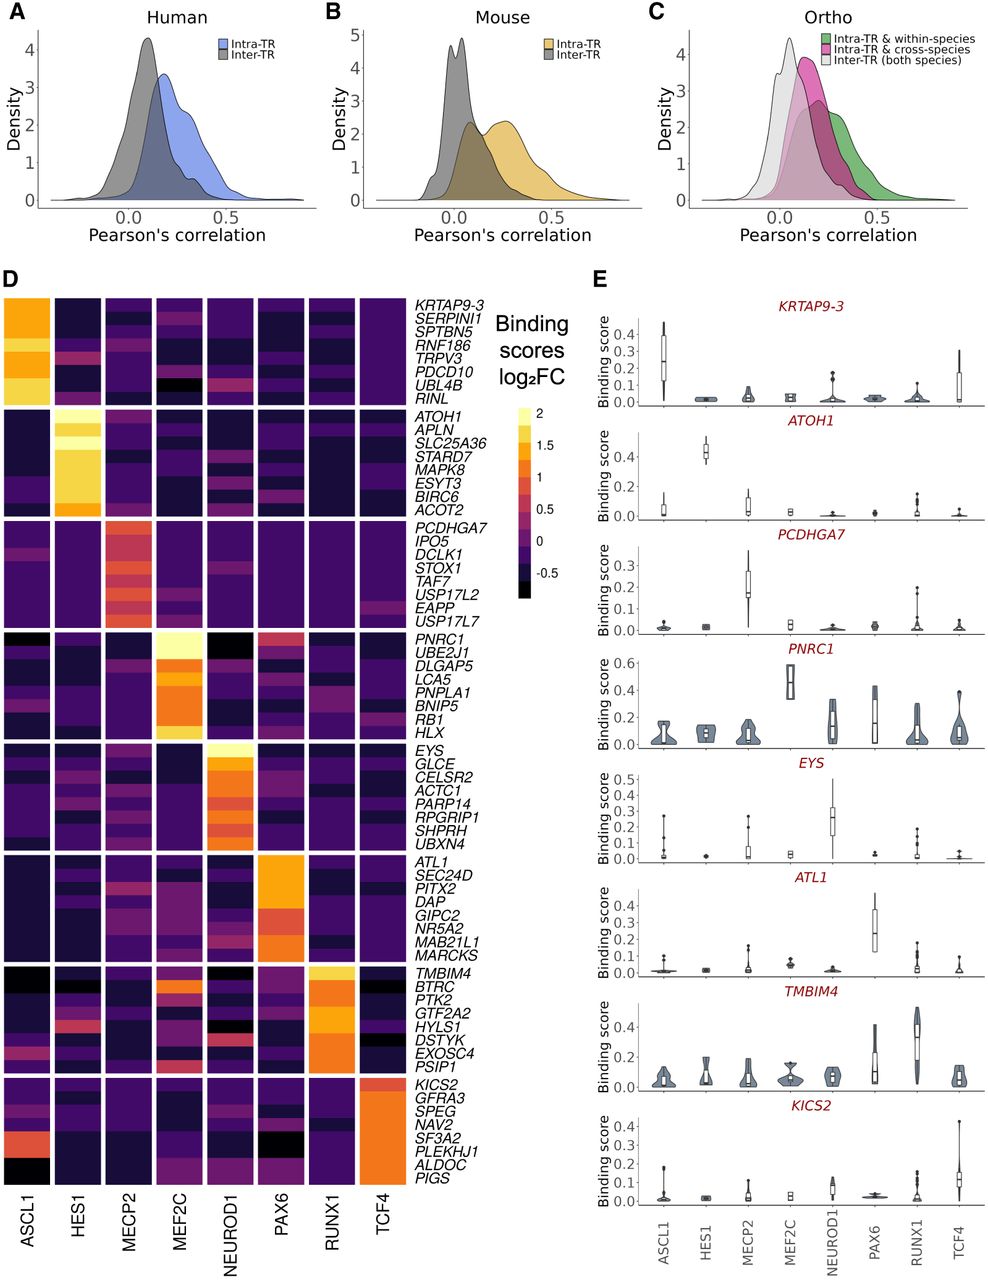
Figure 2.
ChIP-seq experiment similarity and specifically bound genes. (A–C) Distribution of binding score correlations between ChIP-seq experiments targeting the same TR (intra-TR) versus different TRs (inter-TRs). (D) Log2 fold changes of binding scores for the top eight ranked genes (by P-value) for each TR in human experiments using a mixed effect linear model. As scoring was distance based, linearly proximal genes had similar ranks, and so for plotting, only the most significant genes (PCDHGA7 for MECP2 and KRTAP9-3 for ASCL1) are shown. (E) Distributions of binding scores for the most significant gene for each TR from the same model as in D.


