
Figure 1.
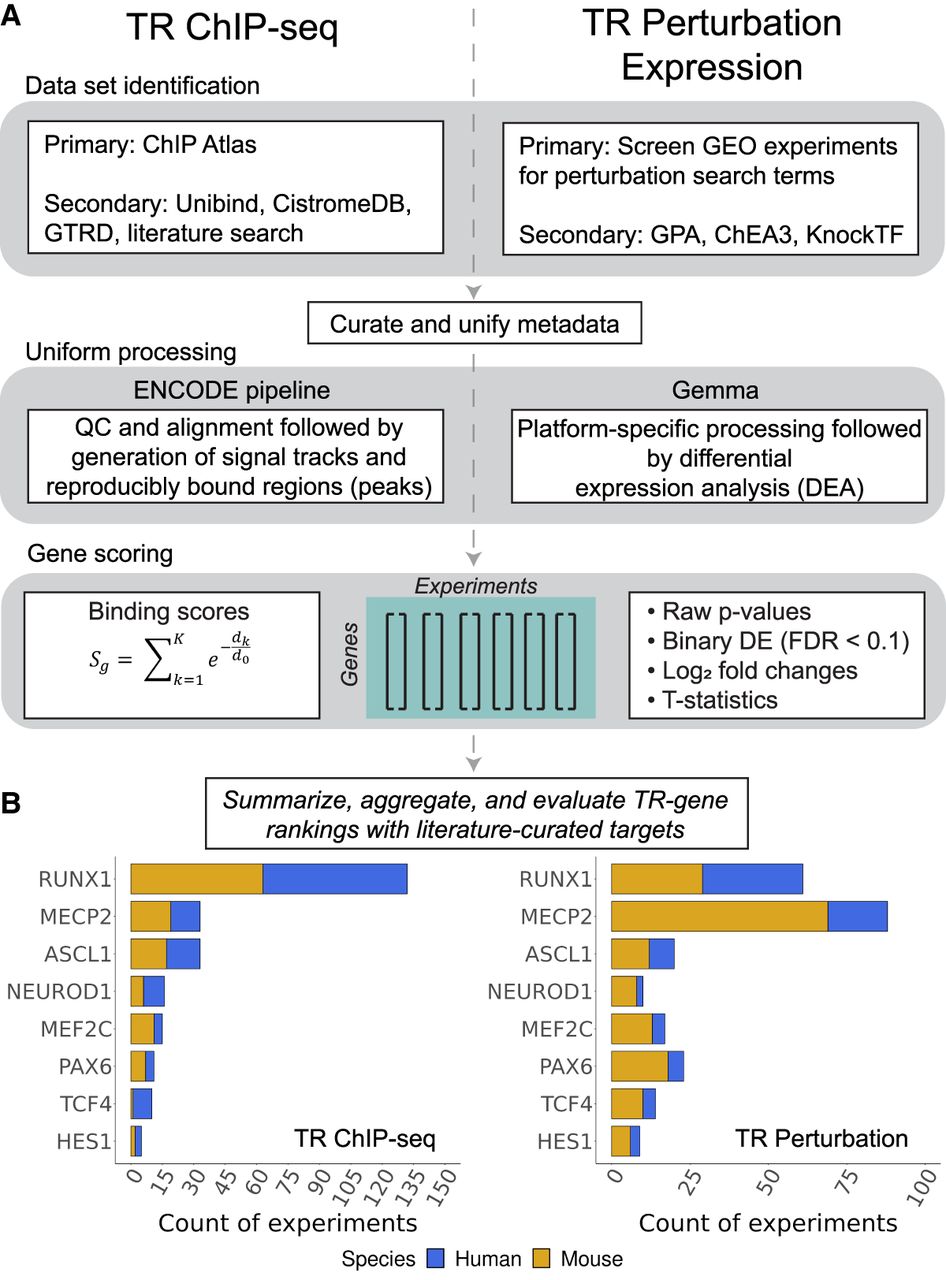
Study overview. (A) Workflow for TR ChIP-seq (left) and TR perturbation (right) data. (B) Counts of TR experiments considered for analysis.
(Downloading may take up to 30 seconds. If the slide opens in your browser, select File -> Save As to save it.)
Click on image to view larger version.
Study overview. (A) Workflow for TR ChIP-seq (left) and TR perturbation (right) data. (B) Counts of TR experiments considered for analysis.
 CiteULike
 Delicious
 Digg
Digg Facebook
 Google+
 Reddit
 Twitter
