
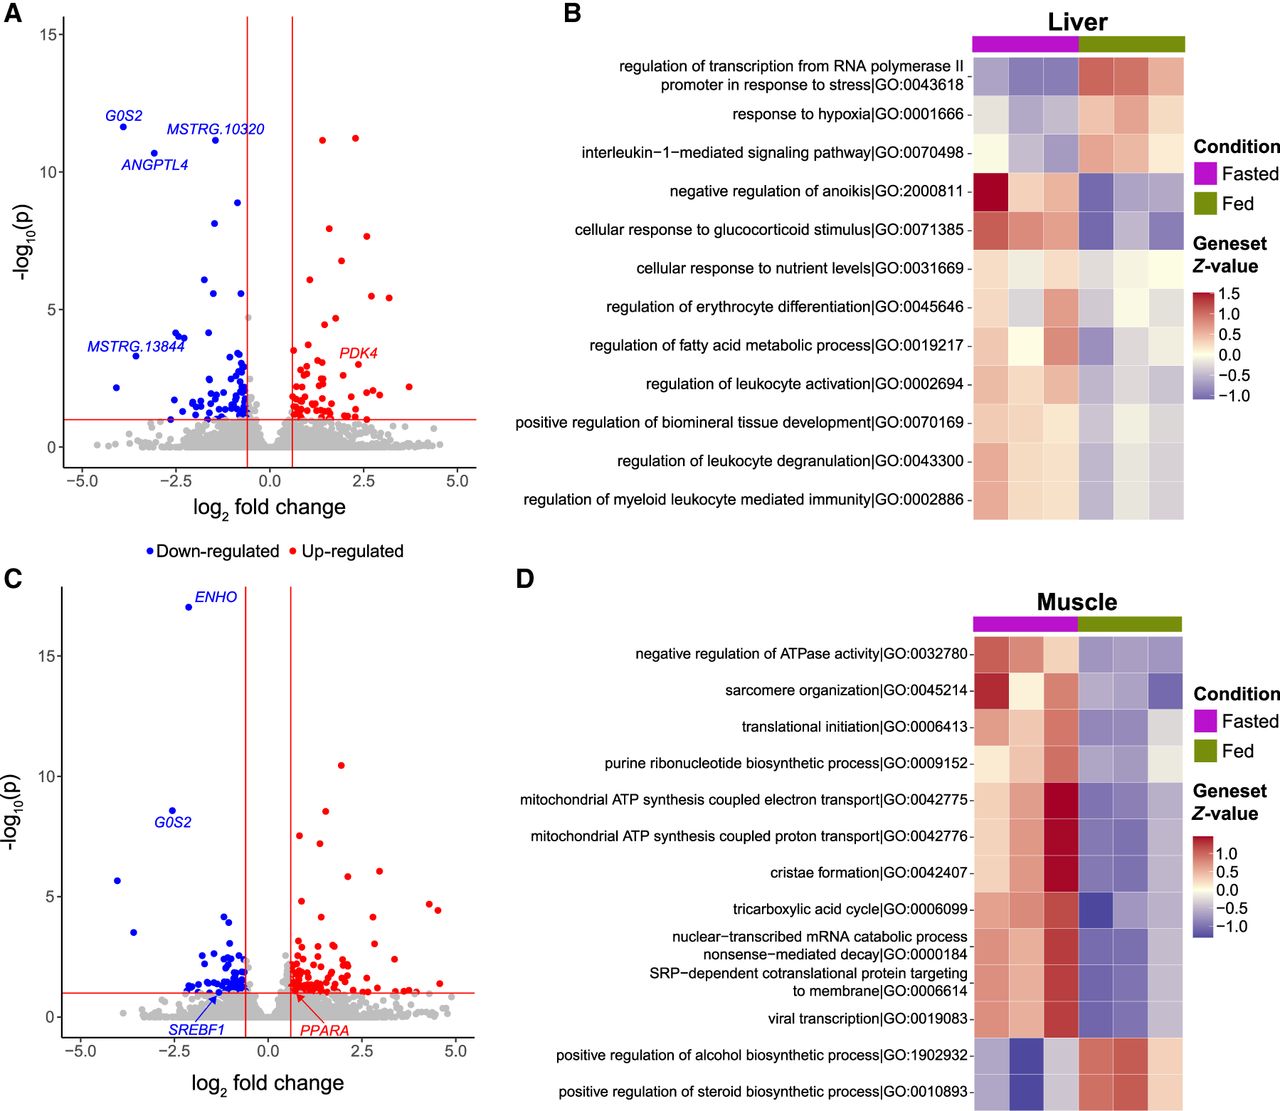
Figure 4.
Differential expression. (A) Volcano plot displaying differentially expressed genes (DEGs) from A. colubris liver tissue comparing fasted to fed. (B) Summary heatmap of top 12 enriched GO terms in the liver. (C) Volcano plot displaying DEGs from A. colubris muscle tissue comparing fasted to fed. (D) Summary heatmap of top 13 enriched GO terms in the muscle.


