
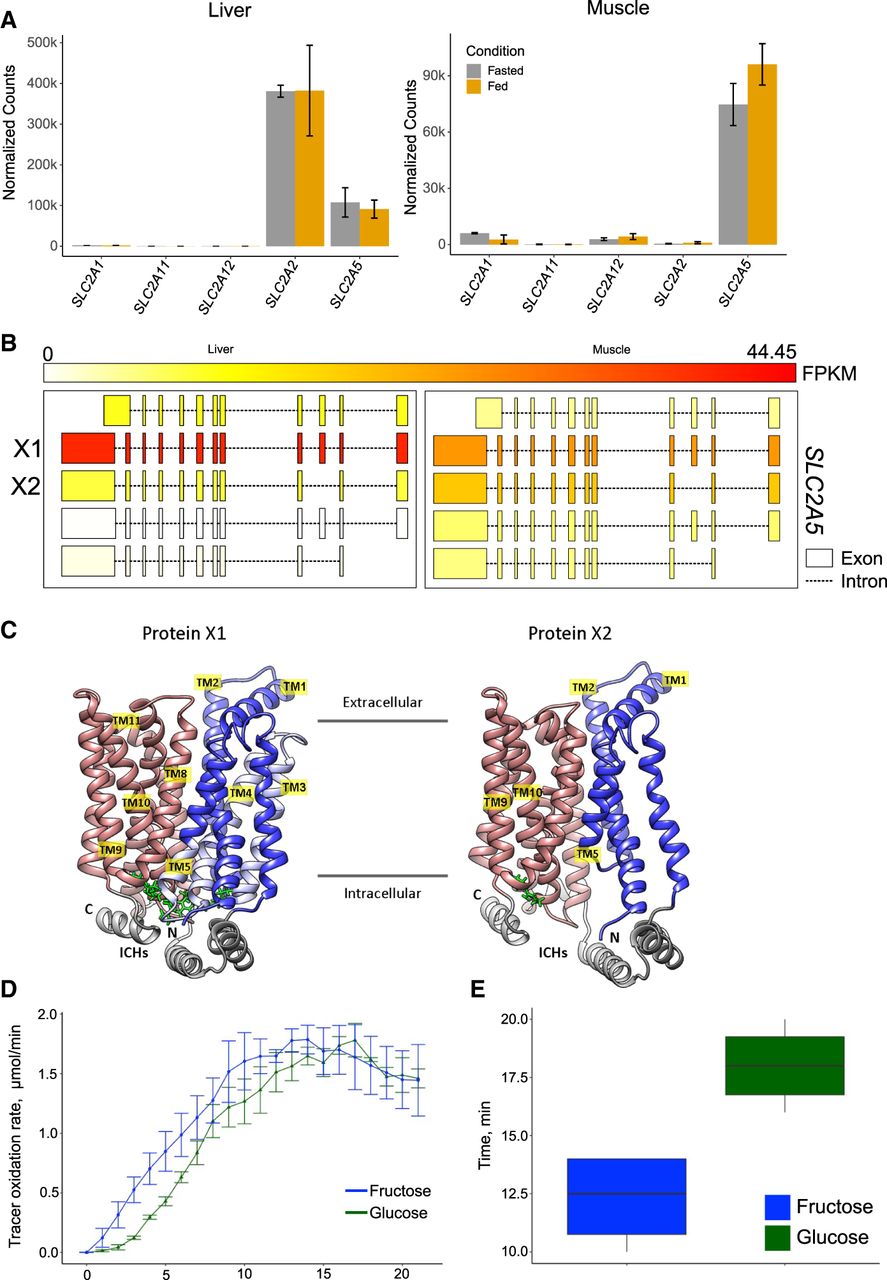
Hummingbird sugar transporters. (A) Normalized gene count plots for ruby-throated hummingbird muscle and liver tissue. (B) Isoform expression of SLC2A5 in the liver (left) and muscle (right). FPKM of each isoform color-coded according to the top scale bar. (C) Ribbon representations of the two protein models for SLC2A5 isoforms predicted by AlphaFold2 based on the mammalian SLC2A5 ortholog. Left is the X1 isoform; right is the X2 isoform that is missing exon 3. In both atomic models, N- and C-terminal TM bundles are colored blue and red, respectively. Regions of the X1 isoform that are missing in the X2 isoform (TM3/TM4) are depicted in light blue. Arginine–glutamate salt bridges at the intracellular tips of TMs are green. (ICHs) Intracellular helices. (D) Tracer oxidation rate over 20 min when birds were fed 13C on either the glucose or the fructose portion of the sucrose disaccharide. (E) Peak oxidation time of glucose and fructose in minutes (P = 0.02, paired t-test).


