
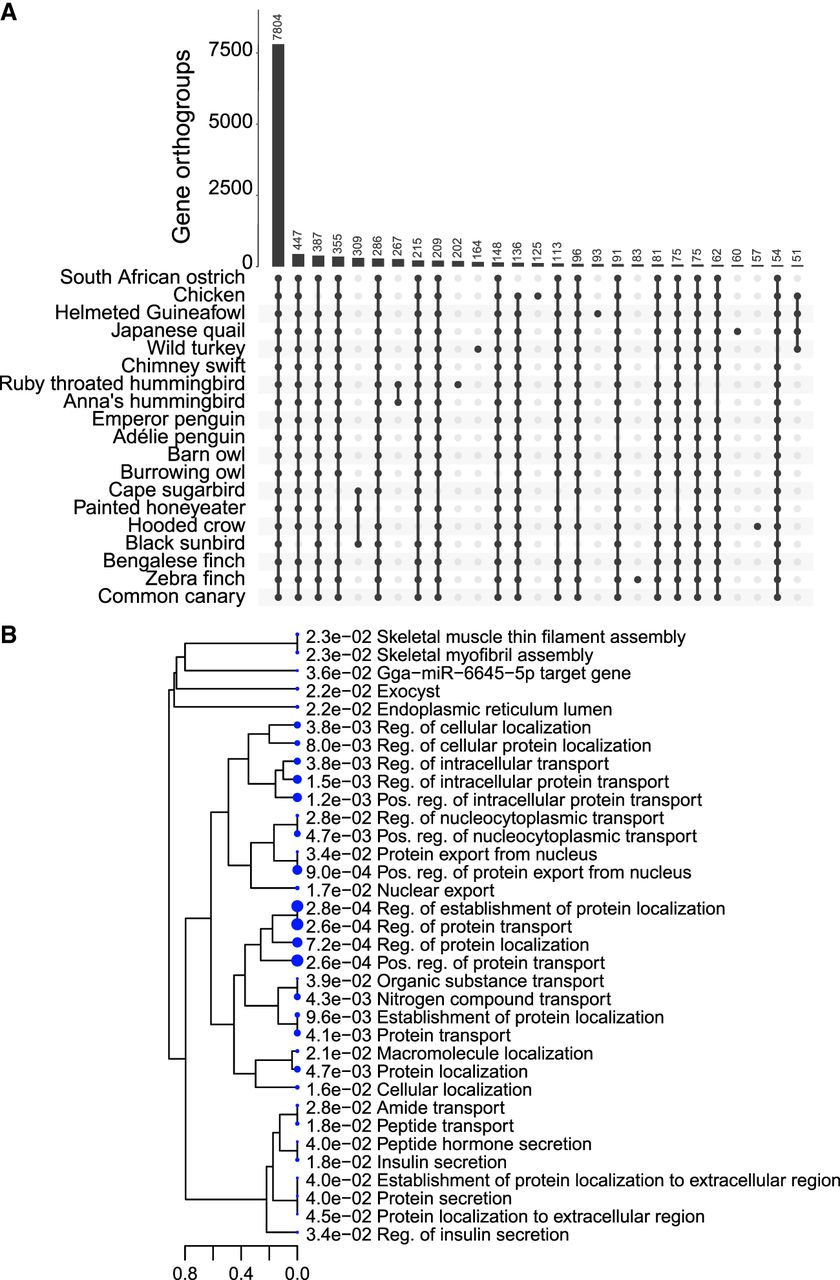
Figure 2.
Positive selection in nectivory. (A) Upset plot illustrating the number of shared orthogroups between the 19 species. Only bars with more than 50 orthogroups are shown. (B) ShinyGO Gene Ontology plot showing a hierarchical clustering tree to summarize the correlation among significant pathways. Pathways with many shared genes are clustered together. Dot size is representative of P-value significance.


