
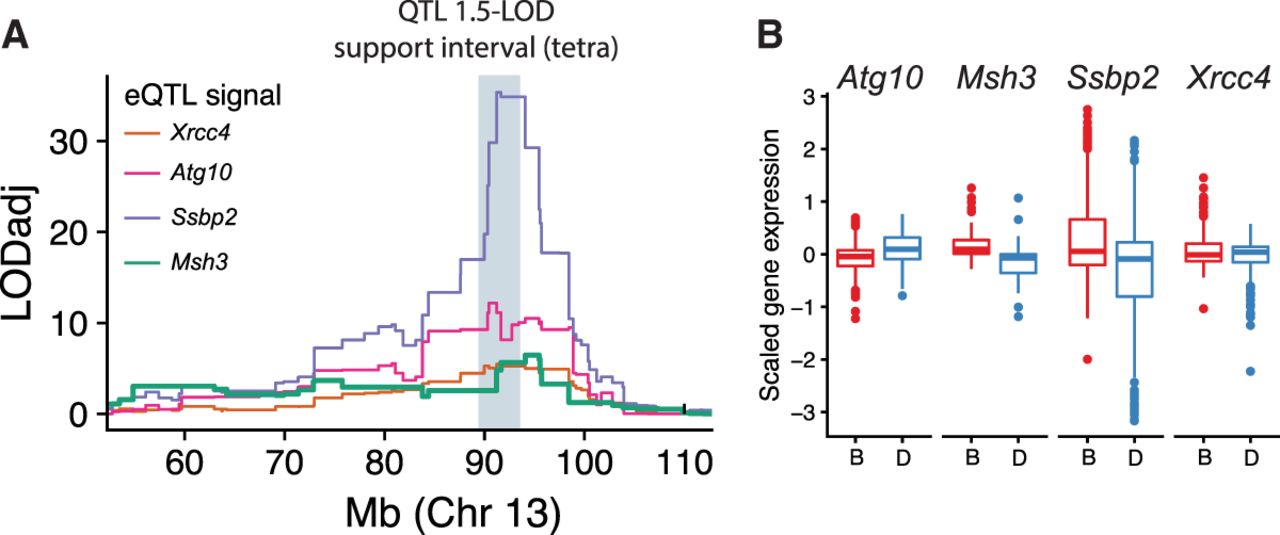
The Chr 13 expansion propensity QTL colocalizes with eQTLs for multiple DNA repair genes. (A) Colocalization of expansion propensity and eQTL signals. Colored traces denote eQTL LOD scores. Each line shows the expression data set with the strongest eQTL for that gene. eQTL LOD scores were adjusted for multiple hypothesis testing for each gene based on the number of probes tested. The gray shaded box shows the 1.5-LOD support interval for the expansion propensity QTL based on tetranucleotide STRs. (B) Distribution of gene expression for strains with B versus D haplotypes. Panels show gene expression for each gene for strains assigned the B (red) versus D (blue) haplotypes at the QTL locus. Data shown are aggregated across all GeneNetwork data sets with a significant eQTL for each gene. Distributions per data set are shown in Supplemental Figure S20.


