
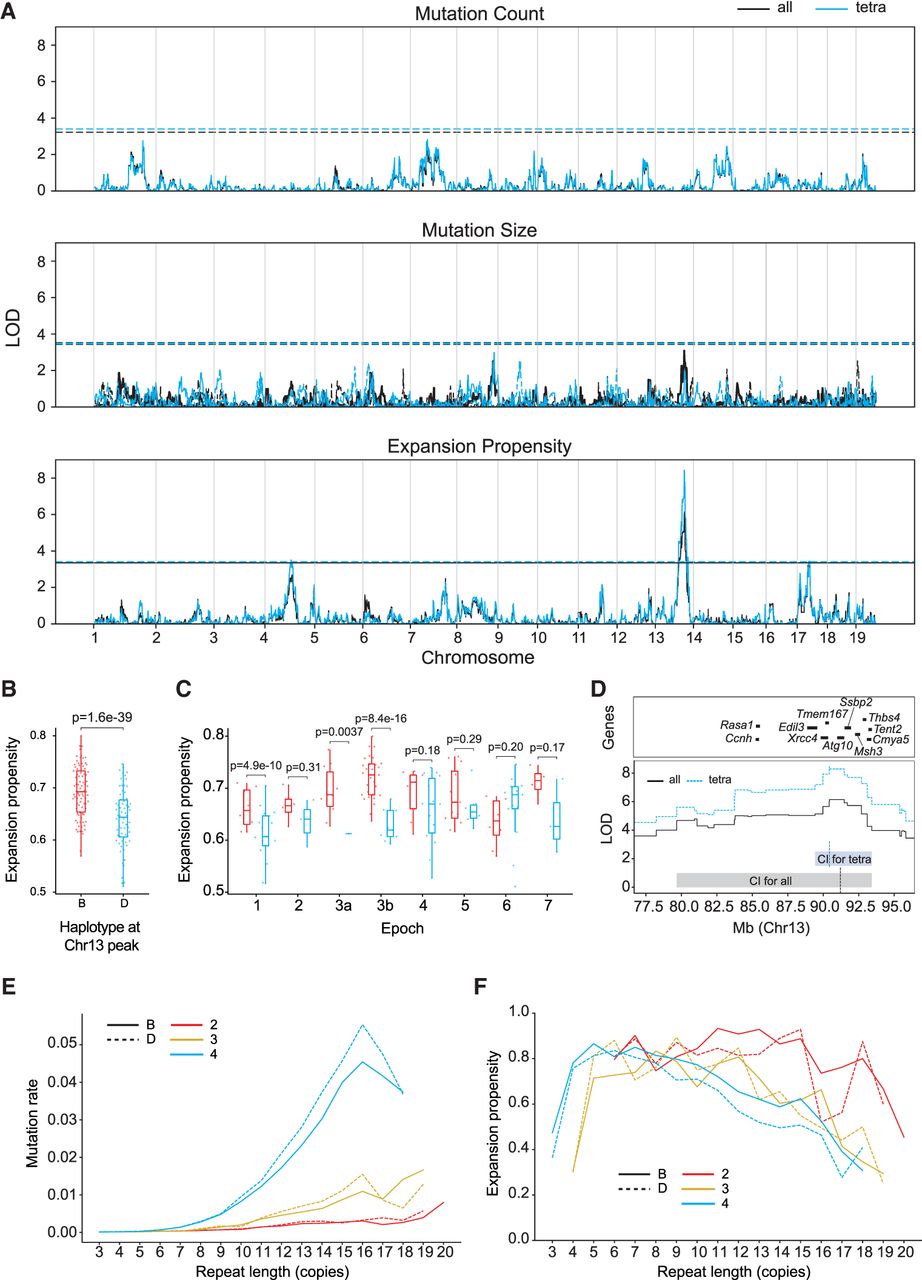
Discovery of QTLs for STR mutation phenotypes. (A) QTL mapping results. Panels show results for mutation count (top), mutation size (middle), and expansion propensity (bottom). The x-axis shows the genomic location, and the y-axis shows the LOD score of each SNP. For mutation size, solid traces and dashed traces represent contraction and expansion mutations, respectively. For each panel, black indicates the phenotype based on all STRs; blue, the phenotype based on tetranucleotide STRs only. Dashed horizontal lines show genome-wide significance thresholds based on permutation analyses. (B,C) Increased expansion propensity is associated with the B haplotype at the Chr 13 QTL. Each point represents one strain. We used SNP haplotype blocks to assign each strain as harboring either the B (red) or D (blue) haplotype at this locus. The y-axis denotes expansion propensity. Panel B shows the trend across all BXD strains, and panel C shows the trend separately for each epoch. Horizontal lines show median values; boxes span from the 25th percentile (Q1) to the 75th percentile (Q3). Whiskers extend to the minimum and maximum data points in each group. For panels B and C, annotated P-values are based on a two-sided z-proportion test. (D) Genes located in or near the QTL peak. The y-axis shows the QTL signal (LOD score) for expansion propensity at Chr 13. Black line indicates all STRs; blue line, tetranucleotide STRs. Shaded boxes indicate the 1.5-LOD confidence interval for all STRs (gray box) and tetranucleotides (light blue box). Horizontal bars denote a subset of genes near the center of the QTL peak. A full list of genes in this region is given in Supplemental Table S1. (E) Repeat length versus relative mutation rate. The x-axis gives the repeat length of each STR based on the parent haplotype at each locus in each strain. The y-axis gives the relative mutation rate of STRs in each bin, computed as the number of mutations divided by the total number of nonmissing genotype calls falling in each bin. (F) Repeat length versus expansion propensity. The x-axis is the same as in E. The y-axis gives the proportion of mutations observed in each bin that are expansions. For E and F, red indicates dinucleotides; gold, trinucleotides; and blue, tetranucleotides. Dashed lines indicate D haplotype; solid lines, B haplotype at the Chr 13 QTL locus.


