
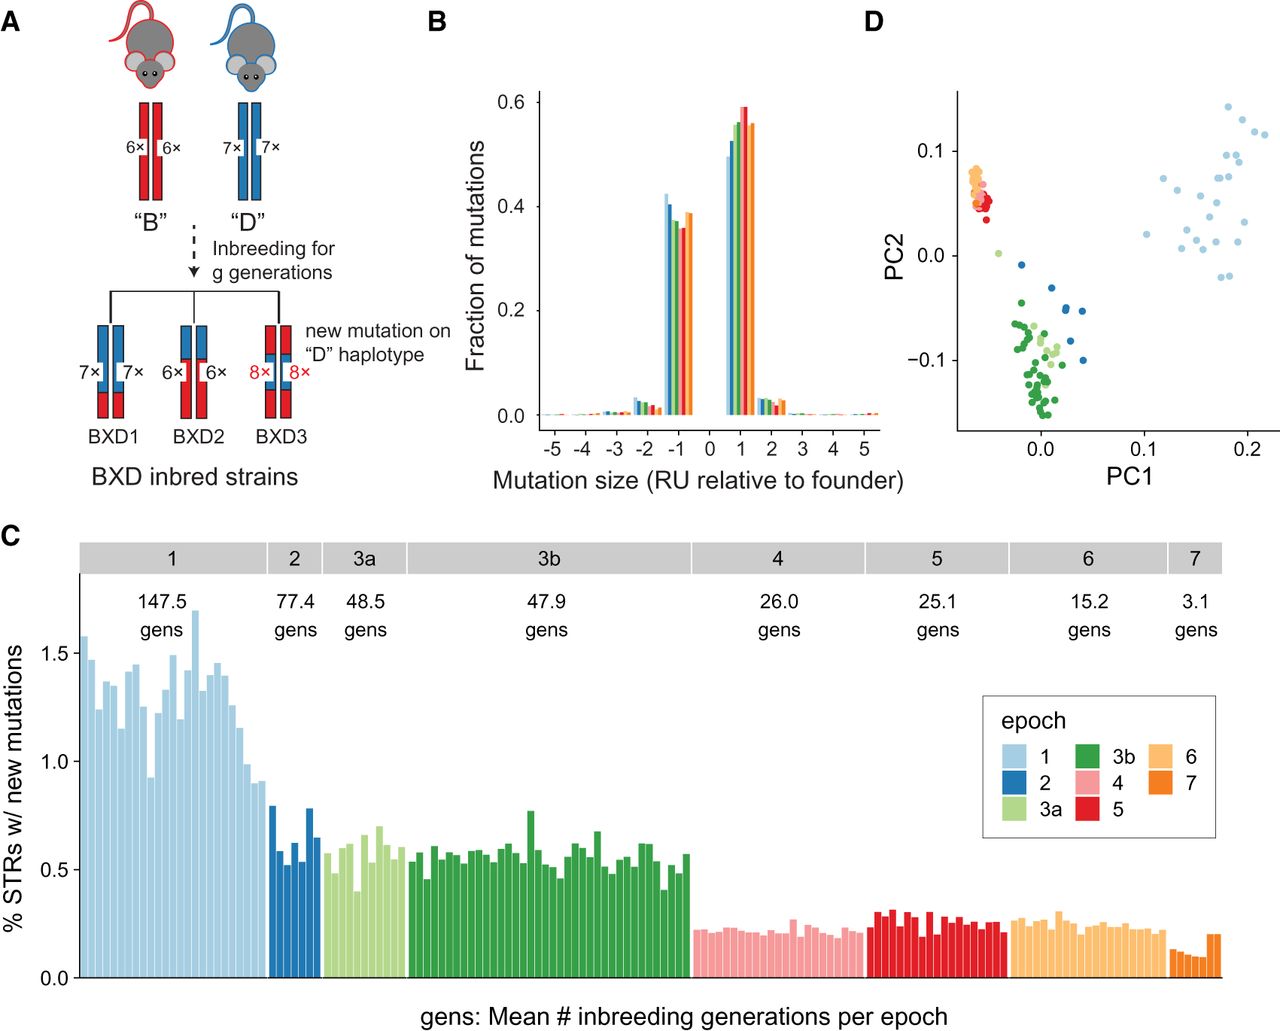
Characterizing new mutations in the BXD family. (A) Schematic of new mutation discovery. Each strain's genome is a homozygous patchwork of segments derived from multiple generations of inbreeding of the descendants of the founders, C57BL/6J (B; red) and DBA/2J (D; blue). A full description of the breeding history for each epoch is described in Supplemental Figure S1 of Ashbrook et al. (2021). Our STR mutation discovery pipeline considers a fixed set of STRs discovered in the mm10 reference genome (in the example shown, B has six copies and D has seven copies of the repeat for a particular STR). We identify new mutations as STRs with repeat lengths differing from the length of the founder inferred at that genome segment. In the example, strain BXD3 has a mutation to eight copies that occurred on a haplotype inherited from the D founder. (B) Distribution of mutation sizes for each BXD epoch. The x-axis shows mutation sizes in terms of the difference in number of repeat units (RUs) from the founder allele. Positive sizes indicate expansions, and negative sizes indicate contractions. Distributions are calculated separately for strains belonging to different epochs, indicated by bar color. Mutations range in size from –16 to +9 RUs, but plots are restricted to ±5 because 99.9% (52,784/52,812) of observed mutations fall in this range. (C) Percentage of genotyped STRs with a new mutation for each strain. New mutations refer to any STR for which the observed allele does not match the expected founder allele. The average number of generations of inbreeding for strains is annotated for each epoch. Strains are sorted by decreasing numbers of inbreeding generations within each epoch. (D) Principal component analysis (PCA) of new mutations. PCA was performed on a binary matrix indicating whether each strain does or does not carry the new allele at each STR. The first two principal components separate strains by epoch, indicating combinations of new mutations are shared among strains in each group. For B–D, colors denote BXD epochs, as annotated in panel C.


