
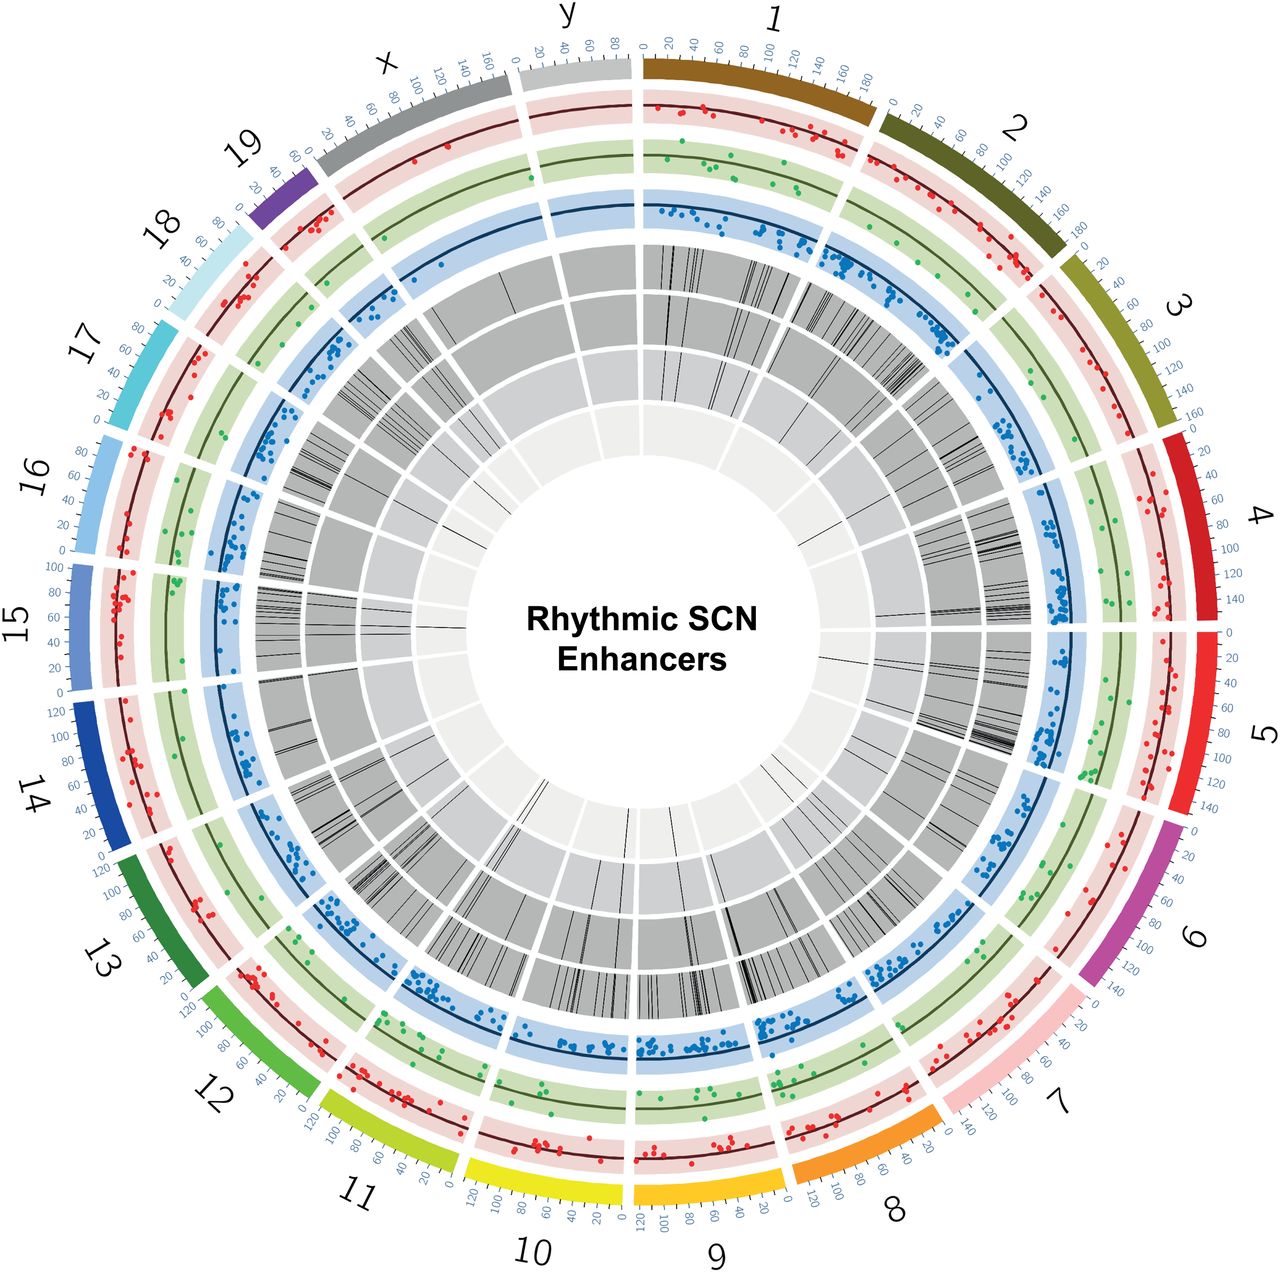
Snapshot of rhythmic H3K27ac abundance and overlapping eRNAs in the SCN. Circos plot (Krzywinski et al. 2009) for dynamic SCN-enriched enhancers with mm10 genome assembly and seven layers (outer to inner). (Layer 1) Differential H3K27ac sites as scatter plot (n = 293) between ZT3 and ZT15 (red). (Layer 2) Differential H3K27ac sites (n = 138) between ZT7 and ZT19 (green). (Layer 3) Differential H3K27ac sites (n = 582) between ZT11 and ZT23 (blue). (Layer 4) Histogram showing oscillating H3K27ac sites (n = 286; P < 0.05 both ECHO and JTK_CYCLE). (Layer 5) H3K27ac oscillating sites from layer 4 confined to intergenic position (n = 89). (Layer 6) eRNA (n = 37) arising from the intergenic H3K27ac sites highlighted in layer 5. (Layer 7) Subset of rhythmic eRNA (n = 12) coinciding with the rhythmic H3K27ac levels mapped at the intergenic sites.


