
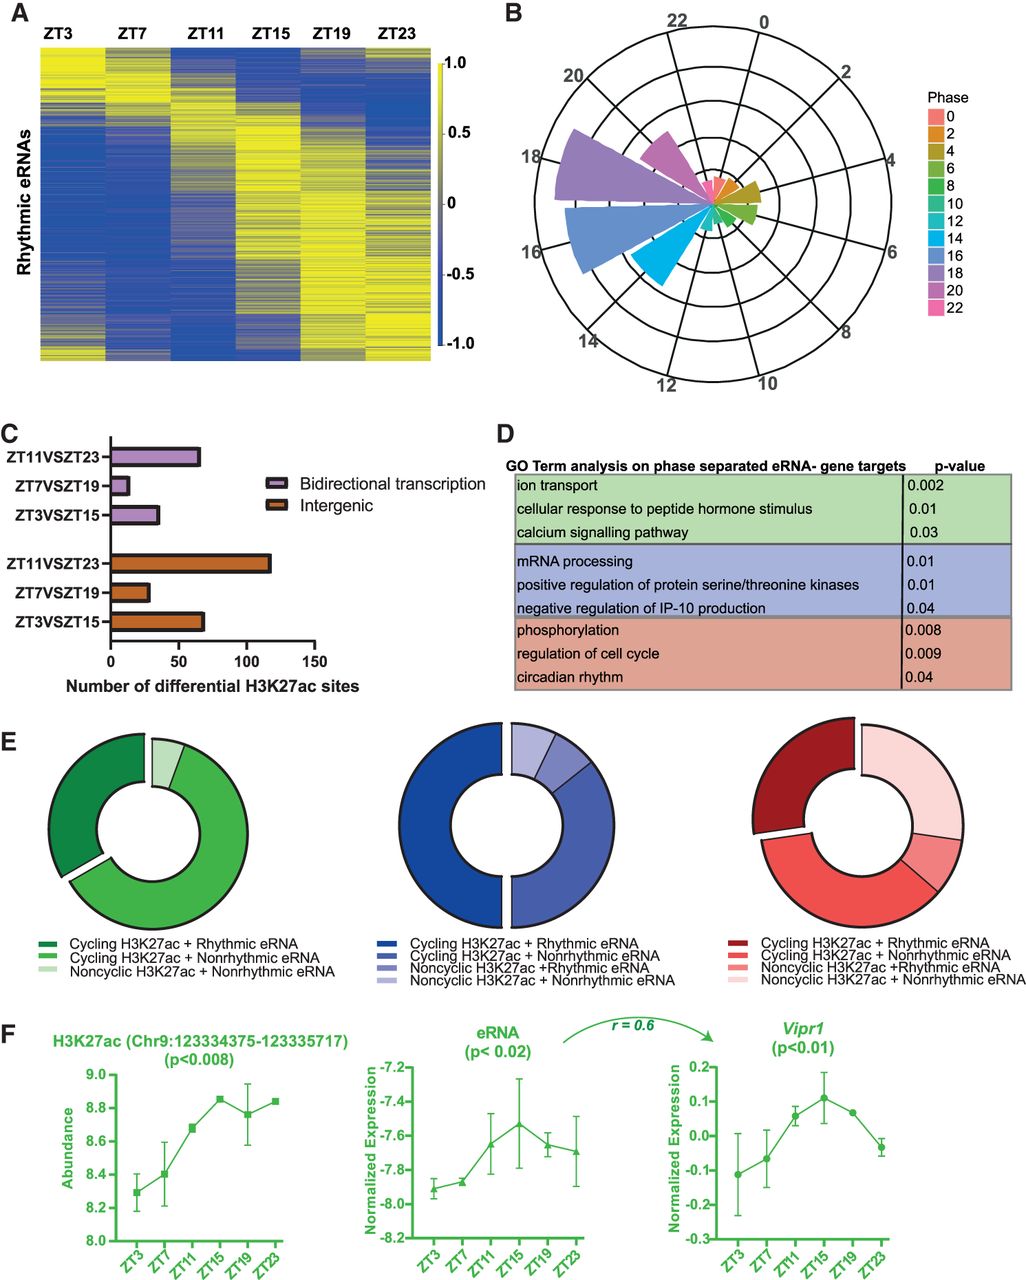
Differing H3K27ac peak abundance linked to rhythmic eRNA. (A) Heat map showing rhythmic eRNA expression throughout the day in the SCN. (B) Phase distribution of oscillating eRNA in 12 groups (2-h interval) depicted by radial plot. (C) Proportion of differential (antiphasic) H3K27ac sites present at intergenic regions showing bidirectional (eRNA) transcription. (D) Functional annotation of target genes controlled by eRNA arising from differential H3K27ac peak abundance at intergenic sites: ZT3 versus ZT15 (green), ZT7 versus ZT19 (red), and ZT11 versus ZT23 (blue). (E) Distribution of rhythmic and nonrhythmic SCN eRNAs arising from 24-h cyclic and/or differential H3K27ac sites between compared antiphasic group. (F) Representative example of rhythmic H3K27ac abundance, eRNA, and positively correlated gene expression (log CPM) as analyzed by ECHO (P < 0.05) with the indicated Pearson's correlation coefficient (r).


