
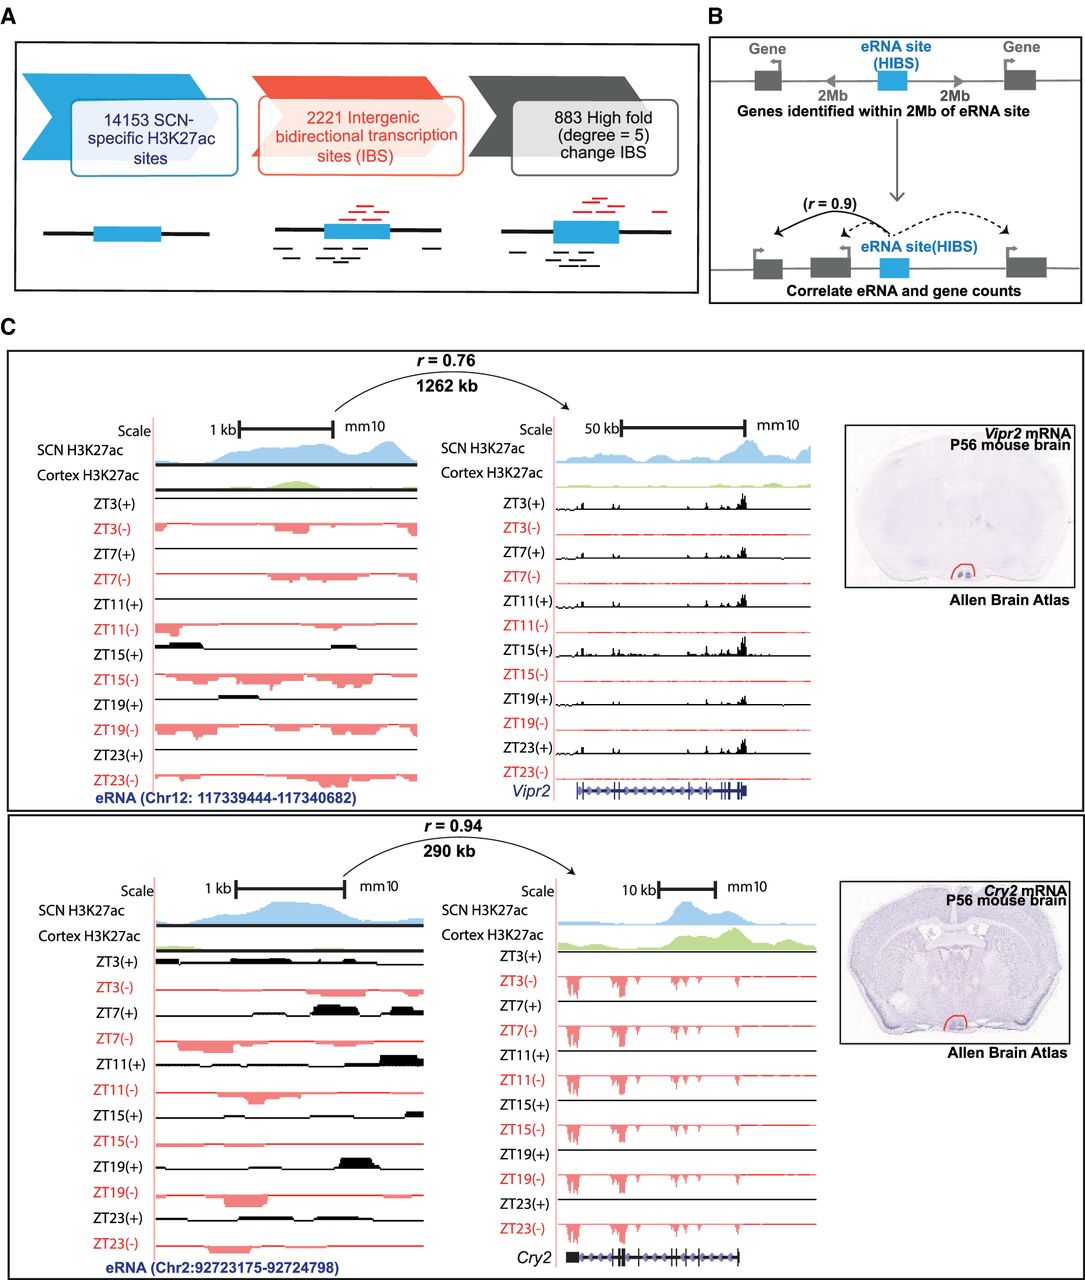
Identification of actively transcribing SCN enhancers (eRNAs). (A) Analysis pipeline for identification of actively transcribing enhancers. (B) eRNA–gene pairs were determined by correlation of eRNA and gene expression levels within a 2-Mb distance cutoff. (C) UCSC Genome Browser tracks showing enhancer-linked H3K27ac signal (normalized ChIP-seq coverage) for cortex (green) and SCN (blue) peaks and total RNA expression (reads mapped to + [black] and – [red] strand) signal as normalized CPM value for two representative examples, that is, Vipr2 and Cry2. The distance between eRNA and predicted target gene with Pearson's correlation is indicated above each represented eRNA–gene pair. SCN expression of the respective target gene is also evident in in situ hybridization images from adult mouse brain (right; image credit: Allen Brain Atlas, Allen Institute).


