
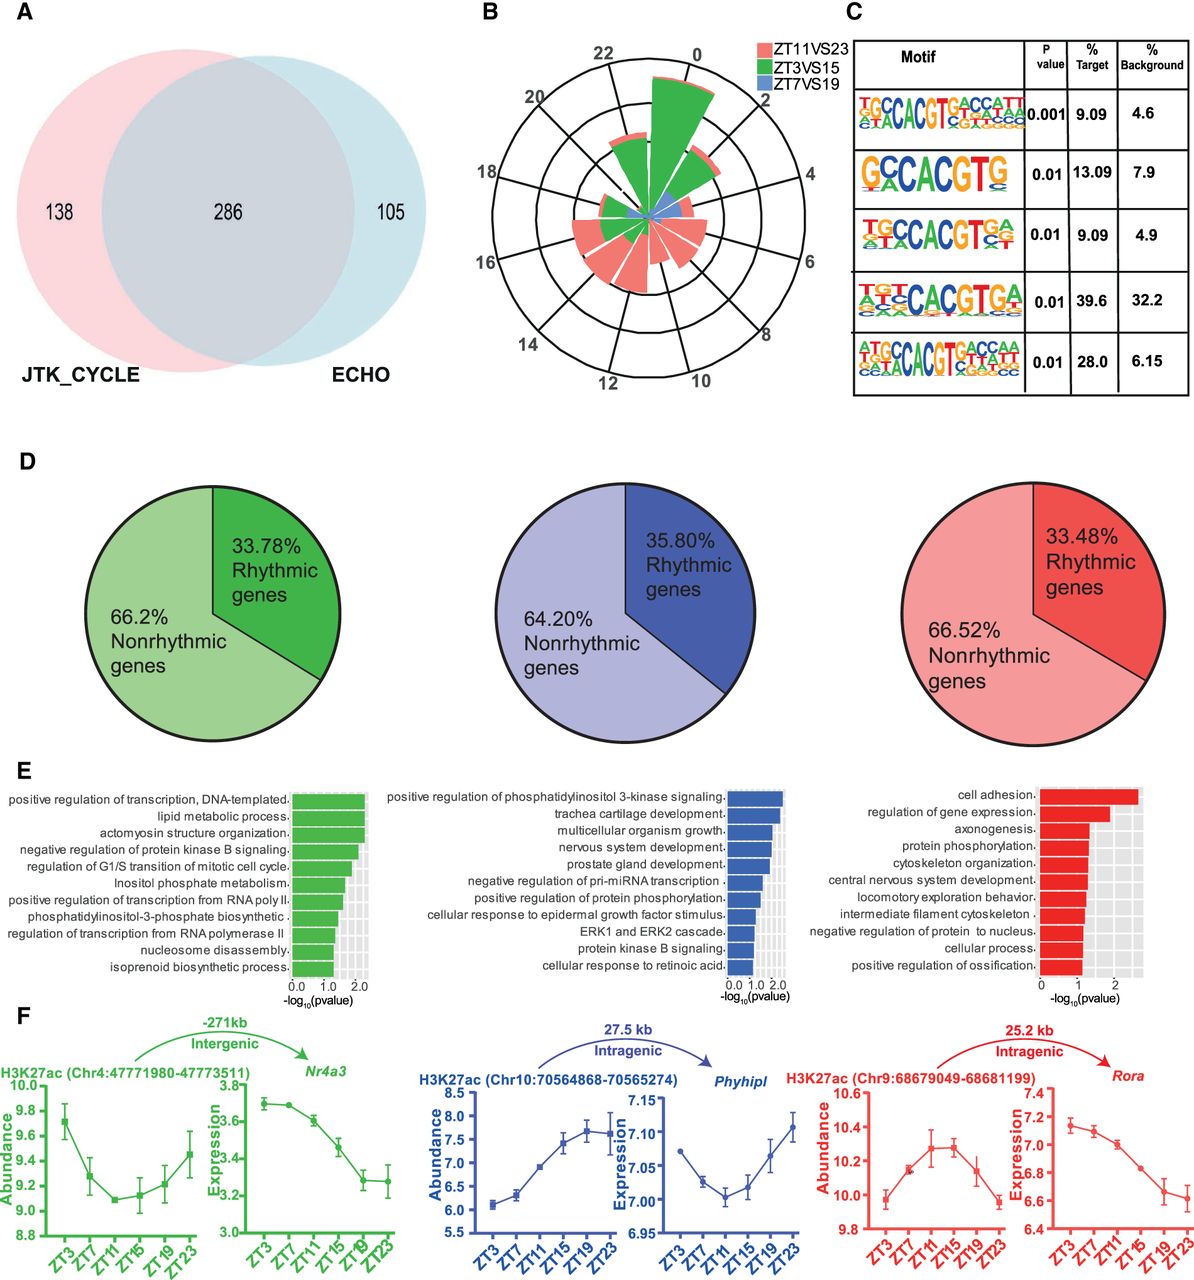
Rhythmic H3K27ac occupancy linked to cycling gene expression in the SCN. (A) Venn diagram showing overlap of rhythmic H3K27ac abundance as analyzed by ECHO and JTK_CYCLE in the SCN. (B) Phase distribution of cycling H3K27ac peaks that were found differential in ZT3 versus ZT15 (green), ZT7 versus ZT19 (blue), and ZT11 versus ZT23 (red) groups denoted by a rose plot. (C) Overrepresentation of the E-box motif (CACGTG) in oscillating H3K27ac sites (HOMER). (D) Proportion of rhythmic genes mapped adjacent to rhythmic H3K27ac regions for each phase separated enhancer group. (E) Functional annotation of rhythmic genes found in close proximity of cycling H3K27ac abundance, peaking at distinct time (ZT), using GO (biological process) and KEGG pathway (DAVID). (F) Representative examples of rhythmic H3K27ac and target gene expression (P < 0.05) with distance to TSS and genomic location shown at top.


