
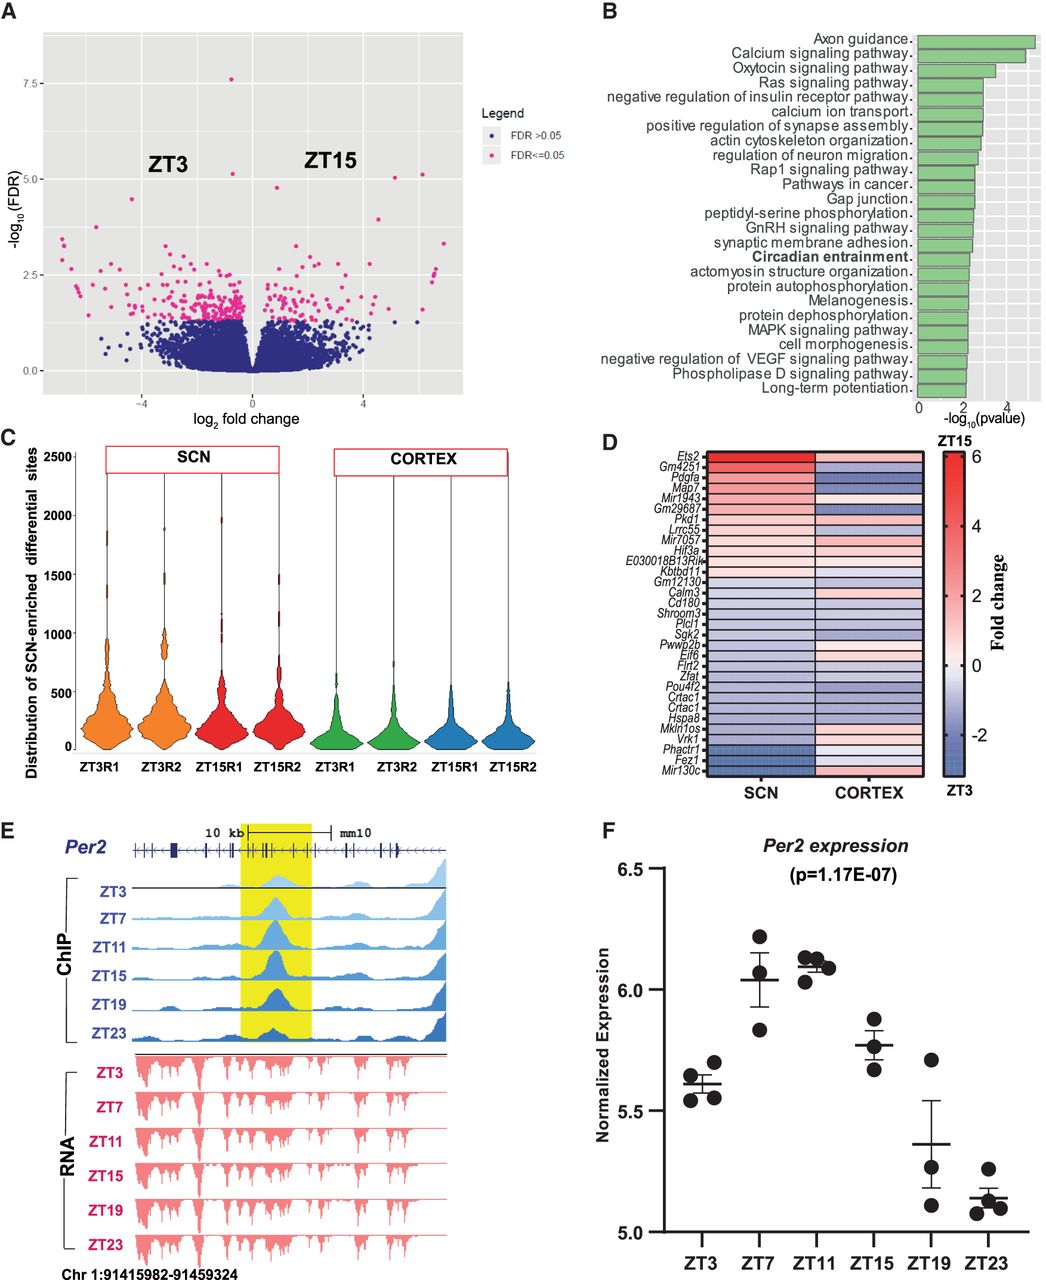
Dynamic H3K27ac occupancy based on time of the day. (A) Volcano plot showing fold change and FDR for differential H3K27ac sites in the SCN between ZT3 and ZT15 (n = 293) as computed by Diffbind. (B) Functional annotation of nearest gene (TSS) from differential (ZT3 vs. ZT15) H3K27ac sites using GO (biological process) and KEGG pathway (DAVID). (C) Violin plot showing distribution of differential H3K27ac peaks at ZT3 and ZT15 in the SCN and cortex: (R1) replicate 1, (R2) replicate 2. (D) Heat map view of differential H3K27ac sites (ZT3 vs. ZT15) observed in both the SCN and cortex. (E) UCSC Genome Browser tracks for H3K27ac intragenic peak (blue with shaded yellow) at the Per2 gene locus showing ZT11 and ZT23 differential peak (fold change = 1.7) along with the gene expression tracks (red) across six time points (ZT3–ZT23) arising from the negative strand. (F) Normalized gene expression level of the Per2 gene across six distinct time points, cycling with a peak at ZT11 and a trough at ZT23; Pearson's correlation (H3K27ac peak and gene expression) = 1.


