
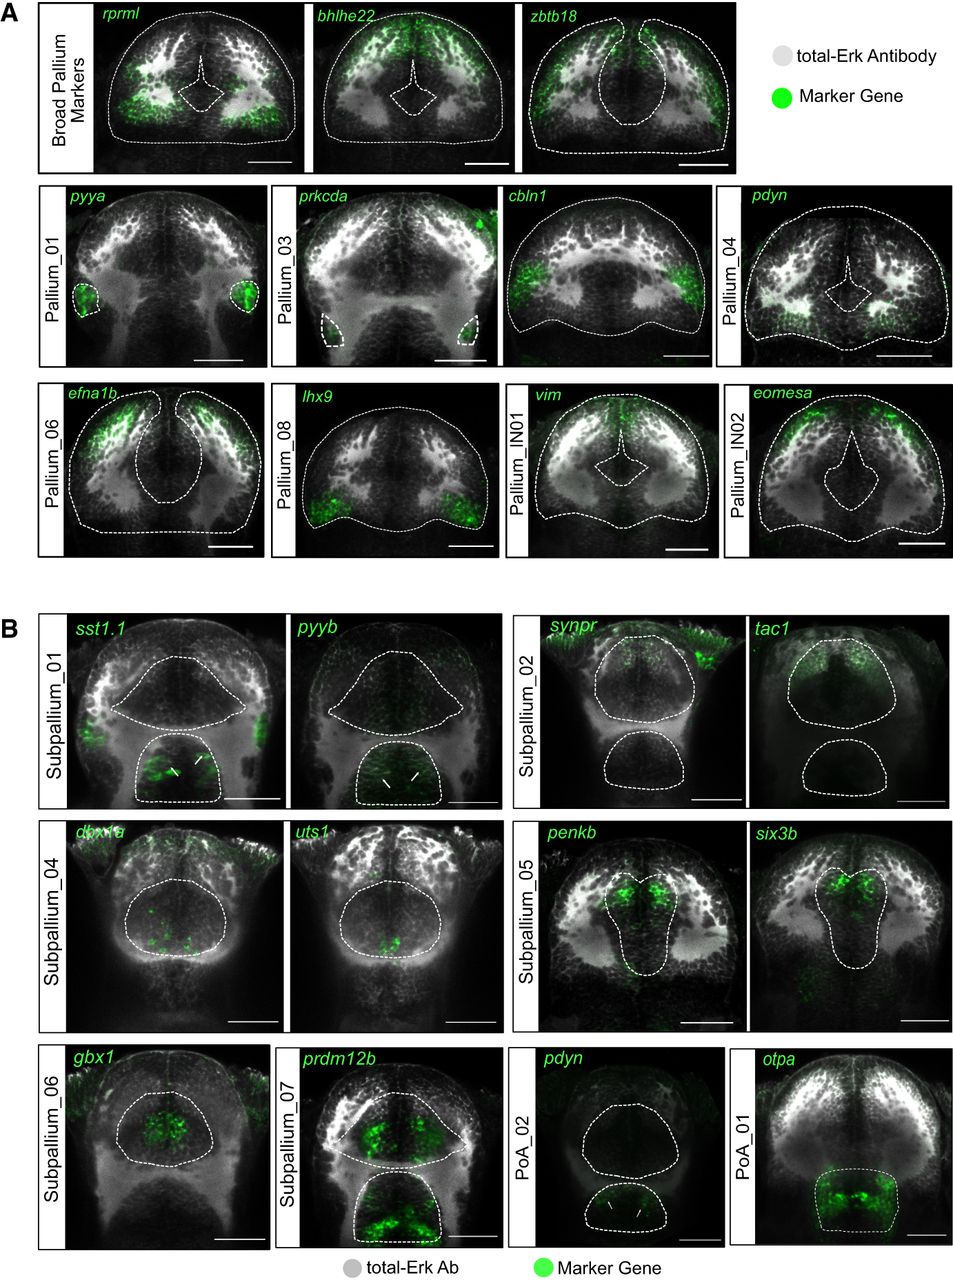
Spatial distribution of neuronal cell types in the larval telencephalon. (A) In situ expression patterns of cluster-specific marker genes for selected subclusters in the pallium at 10 dpf (dorsal view). RNA-FISH (green) was performed with a total-Erk (pale gray) costain for anatomy. Approximate demarcations of the pallium, based on the Z-Brain atlas masks (Randlett et al. 2015), are indicated by white dotted lines. (B) In situ expression patterns of cluster-specific marker genes for selected subclusters in the subpallium at 10 dpf (dorsal view). Approximate demarcations of the subpallium only (Subpallium_04, Subpallium_05, Subpallium_06) or subpallium and preoptic area (all other panels), based on the Z-Brain atlas masks (Randlett et al. 2015), are indicated by white dotted lines. The scale bar represents 50 µm. For the three-dimensional stack and depth information, see Supplemental Video S1.


