
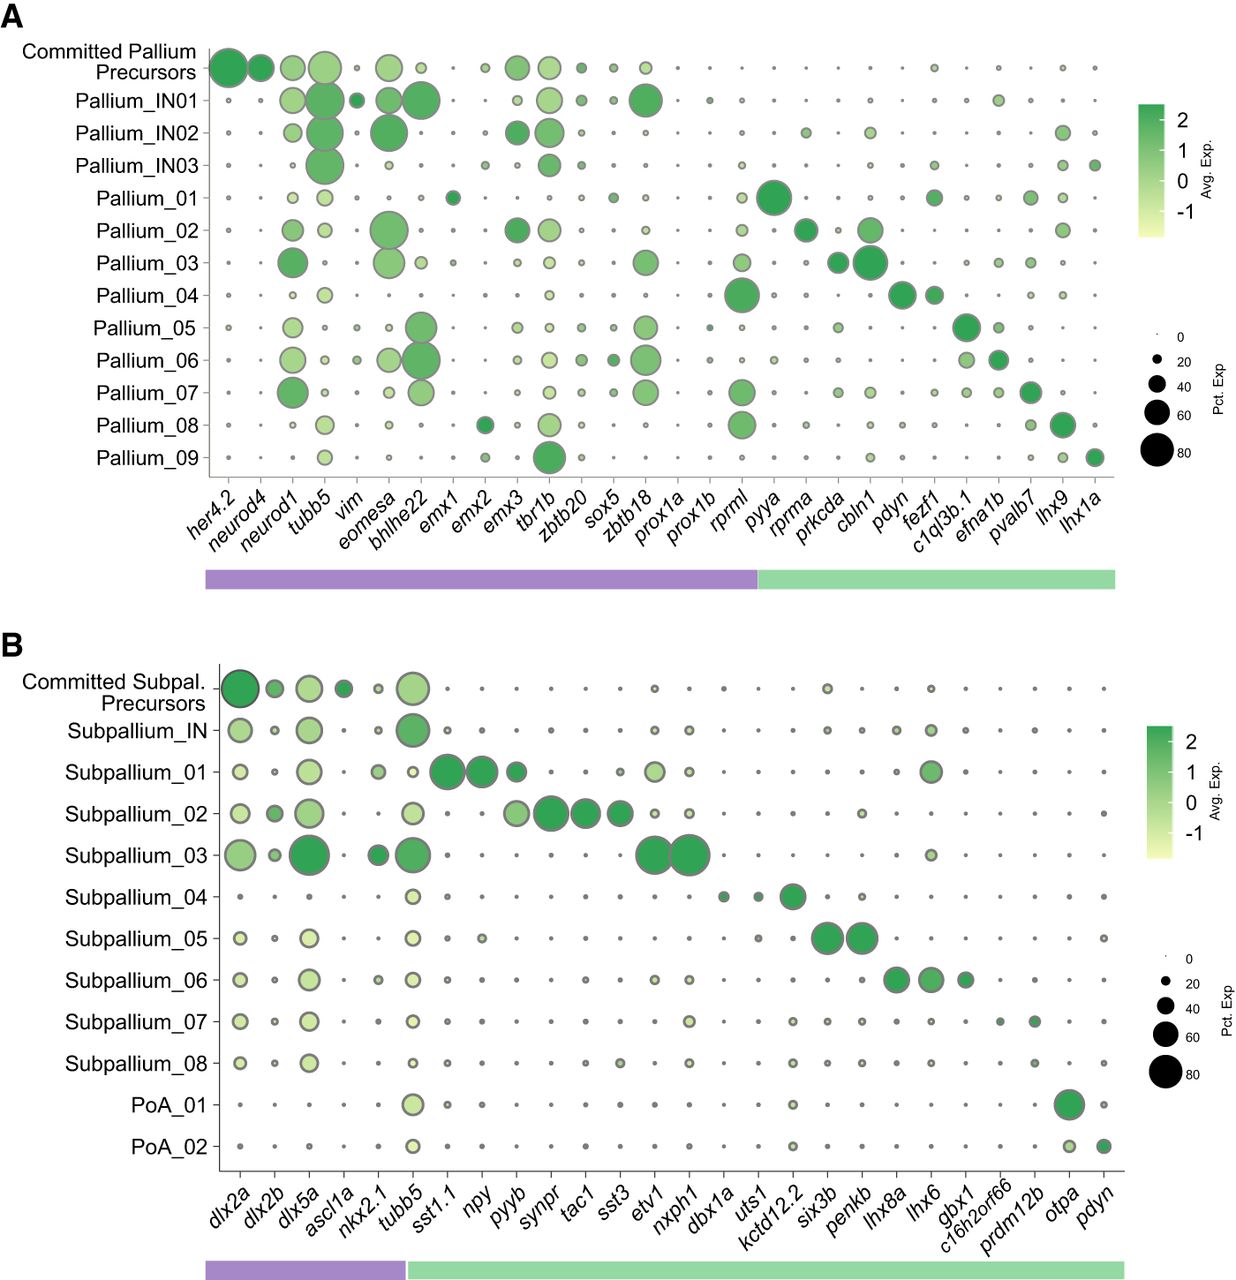
Figure 2.
Marker genes of the neuronal cell types in the larval telencephalon. (A) Expression profiles of marker genes that are specific or enriched in the pallium subtypes. (B) Expression profiles of marker genes that are specific or enriched in the subpallium subtypes. The purple bar on the bottom represents previously defined markers that were used to subcategorize the region, and the green bar represents markers identified by the integrated analysis. For the expression of additional genes, see Supplemental Figure S5 and Supplemental Table S1.


