
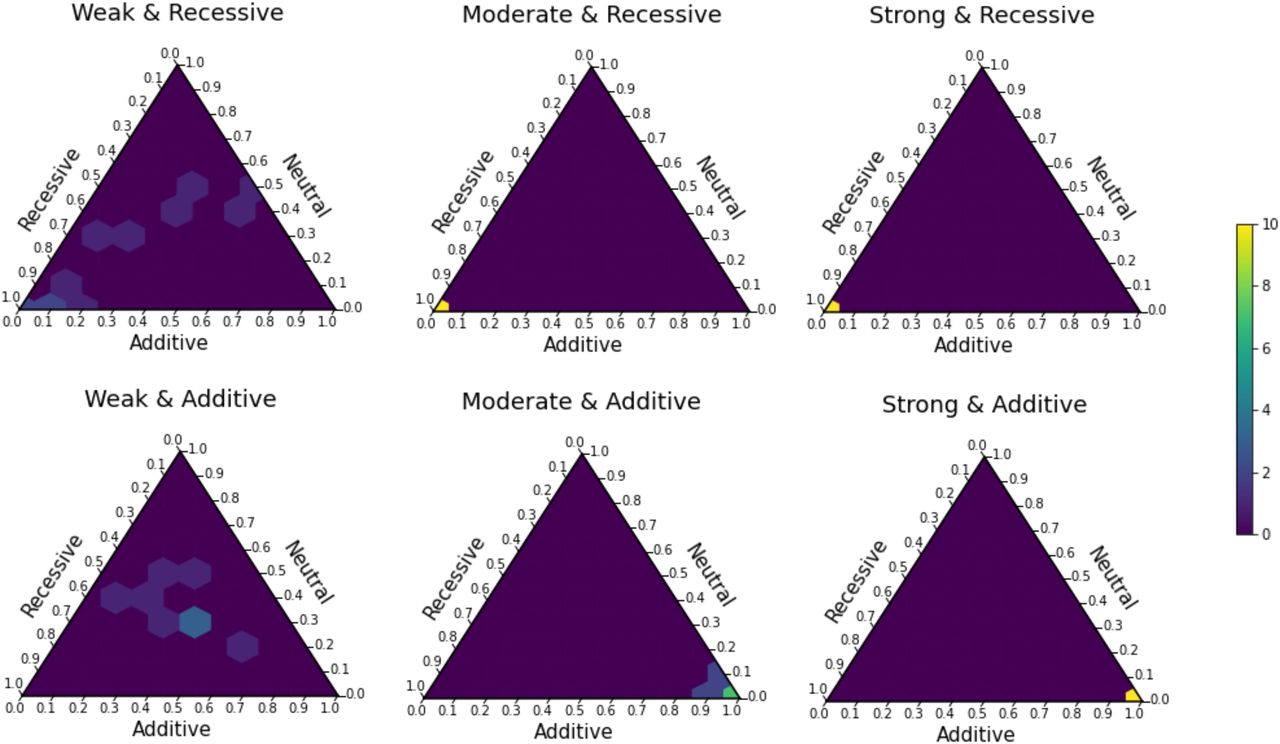
Figure 7.
TIDES can accurately distinguish among neutral, recessive, and additive models of selection. True models are shown above each simplex (weak: s = −0.0001; moderate: s = −0.001; strong: s = −0.01; recessive: h = 0; additive: h = 0.5). The coordinates along each axis denote posterior probabilities assigned to the respective model. The color of each tile represents the proportion of simulations that fall within that probability bin (scale shown at far right).


