
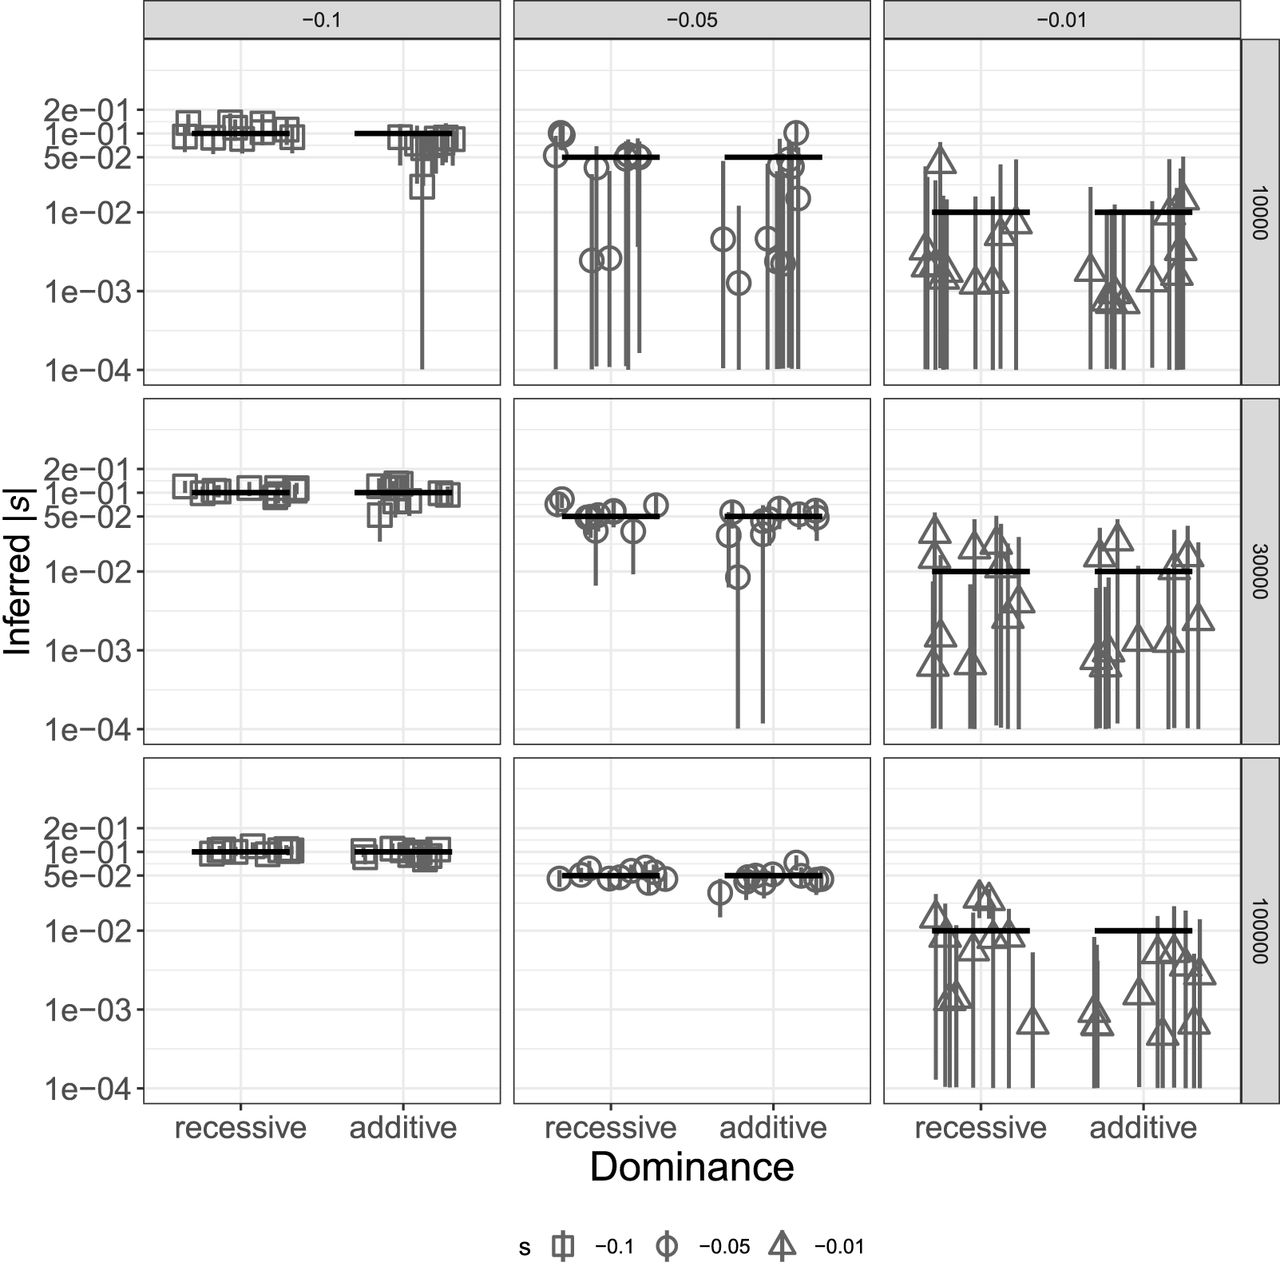
Figure 4.
Inference of s for a single deleterious SNP with different dominance effects. Each scenario includes the estimates from 10 simulated data sets. Columns show different values of the true selection coefficient, and rows show different sample sizes, in terms of the number of trios used. True values are shown as black horizontal segments, with medians of the inferred posterior distributions denoted by gray shapes and their 95% credible intervals by gray vertical lines. The y-axis is in log10 scale; all values are in absolute numbers.


