
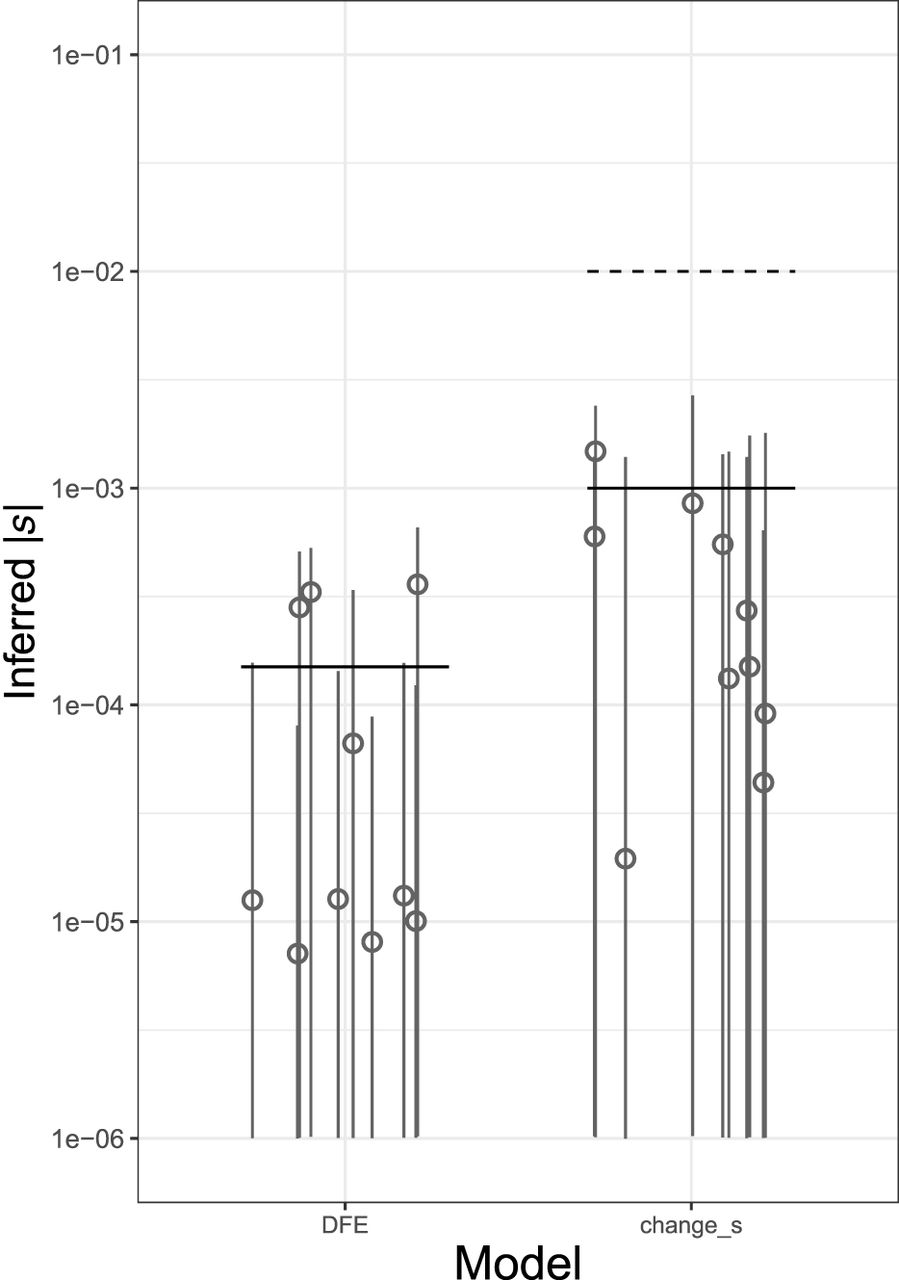
Inference of s from a genome-wide set of deleterious SNPs under complex models of selection. Each scenario includes the estimates from 10 simulated data sets. Left panel shows the results when the true DFE follows a gamma-distribution (mean value of s shown by black horizontal line). The right panel shows the case in which there was a 10-fold reduction in the selection coefficient. Ancient and current values of s shown by dashed and solid horizontal lines, respectively. Medians of the inferred posterior distributions denoted by gray circles and their 95% credible intervals by gray vertical lines. The y-axis is in log10 scale; all values are in absolute numbers. Here, 50,000 trios are used.


