
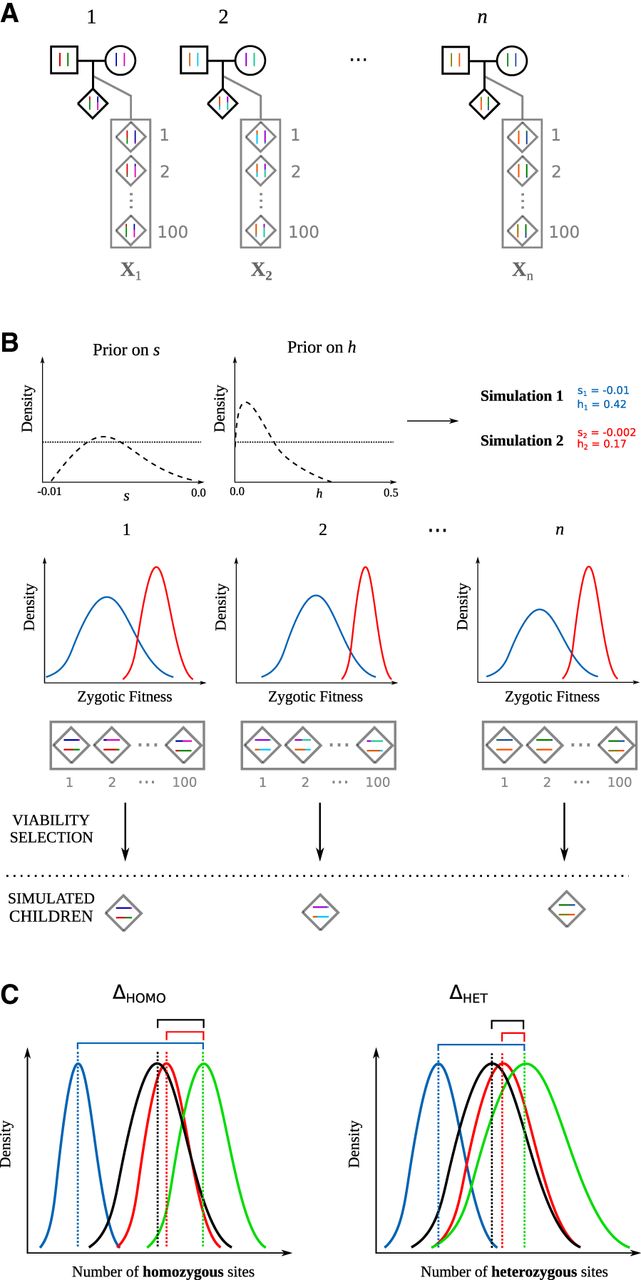
Schematic representation of TIDES. (A) Observed family trios (black outline) together with the zygotes generated from parental haplotypes (gray outline). (B) Illustration of the TIDES simulation engine for two draws from the prior distribution of s and h, representing strong (blue) and weak (red) values of selection. The middle row shows the computation of zygotic fitness and natural selection. (C) Comparison between the observed summary statistics (black offspring/green parents) and the summary statistics from the simulations using the selection parameters from the prior distribution (red and blue). The left panel shows the comparison of the number of homozygous genotypes (ΔHOMO), and the right panel shows the comparison for the number of heterozygous genotypes (ΔHET). In this example, the values of s and h from the red parameter combination better fit the observed data than do the parameters shown in blue.


