
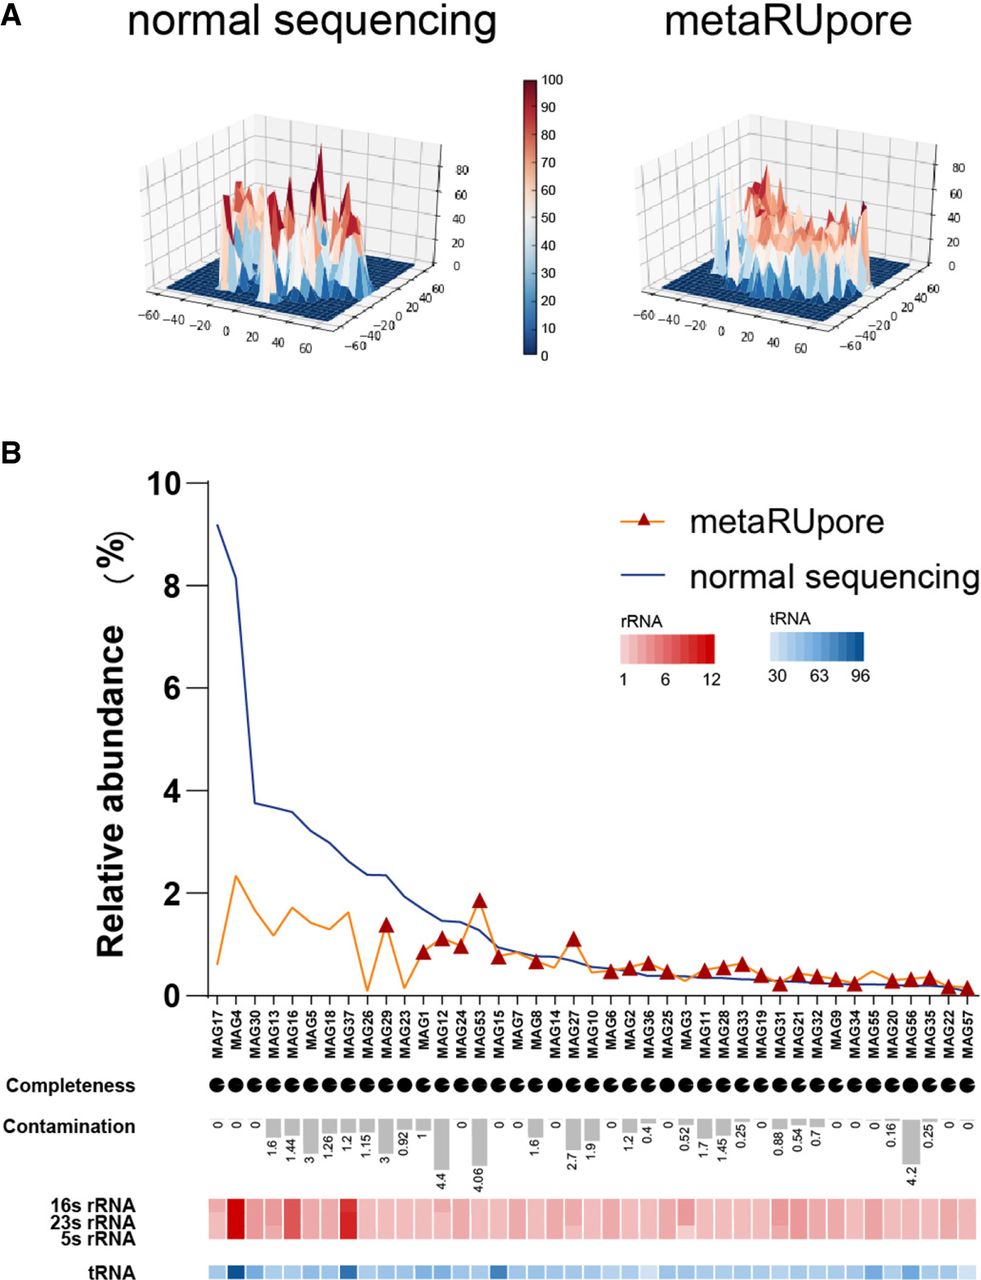
Performance of metaRUpore on recovery of high-quality MAGs in TAD community. (A) 3D density plots of t-SNE downscaling results for normal sequencing data sets and selective sequencing data sets by metaRUpore at four base frequencies, showing that metaRUpore renders the TAD community structure homogenous. (B) The distribution of 41 retrieved HQ MAGs in normal and RU sequencing data set. The red triangles indicate MAGs that could only be assembled in the metaRUpore data set. The pie chart and bar chart represent the level of genomic SCG-completeness and contamination by CheckM. The copy numbers of 16S rRNA, 23S rRNA, and 5S rRNA ribosomal RNA genes are represented by the red heatmap, whereas the copy number of tRNA is represented by the blue heatmap.


