
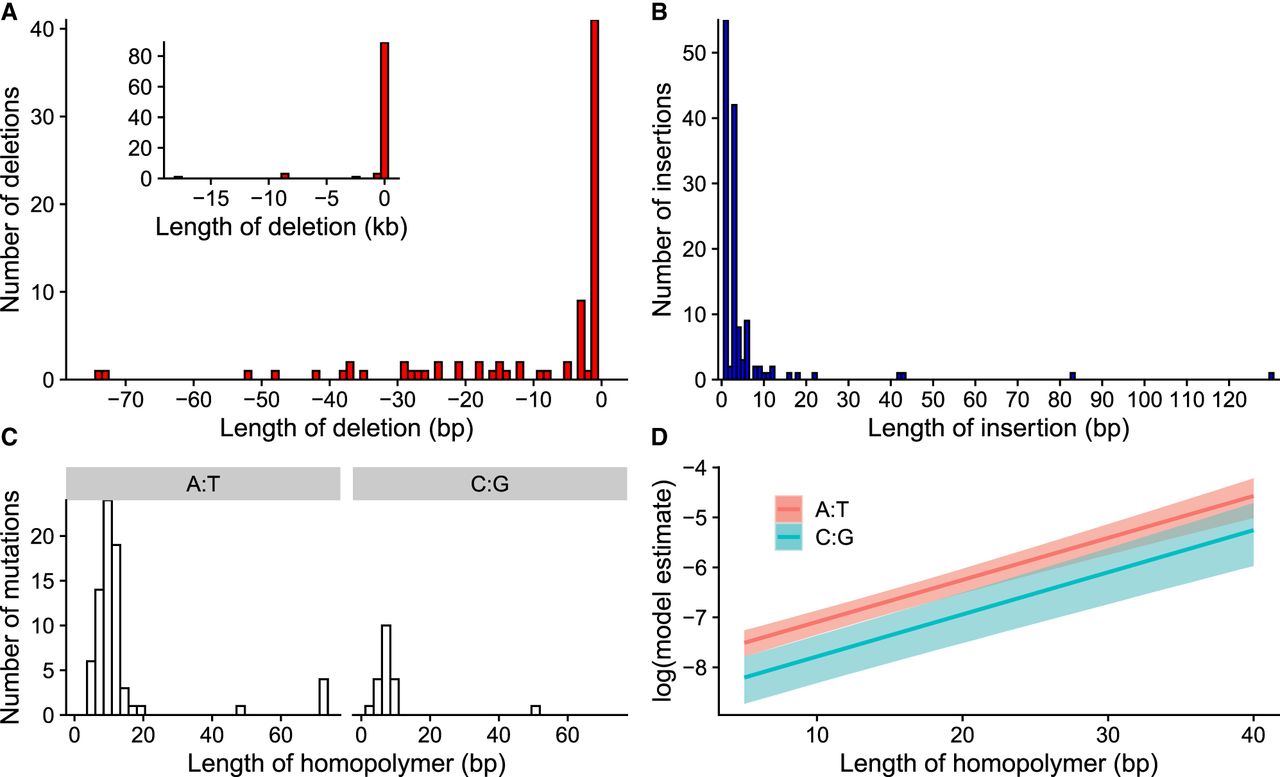
Figure 6.
Properties of deletions and insertions. (A) Distribution of deletion lengths in the range of 0 to 75 bp; inset shows the full distribution. (B) Distribution of insertion lengths. (C) Distribution of homopolymer lengths for those mutations that occurred in either A:T or C:G homopolymer stretches. (D) Model estimates for mutation rate in homopolymers; A:T homopolymers had an overall higher mutation rate, and longer homopolymers had higher mutation rates.


