
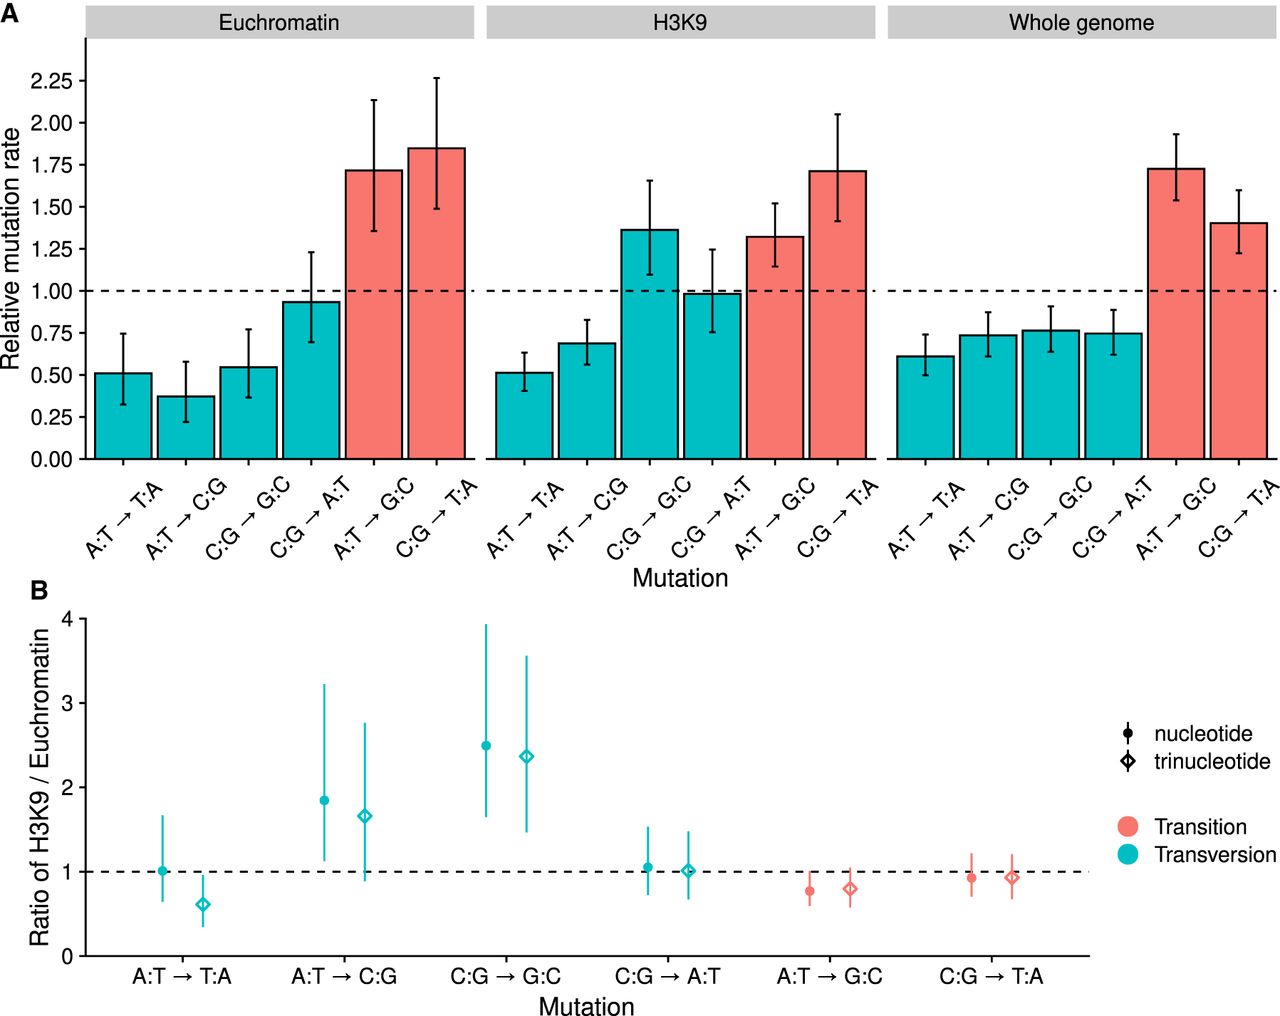
Figure 4.
Mutation spectra. (A) Spectrum of relative SNM rates; the dashed line shows the expected rate if all mutations occurred at equal frequencies. Nucleotide frequencies were taken into account in calculating the relative rates. Error bars are 95% HPD intervals. (B) Ratios of relative mutation rates in H3K9me3 over euchromatin. Points show ratios corrected for nucleotide frequencies, and diamonds show ratios corrected for trinucleotide frequencies. Estimates are medians, and the range shows the 95% HPD interval of the ratio. If the interval estimate is different from one, the mutation rate is different in H3K9me3 domains and euchromatin.


