
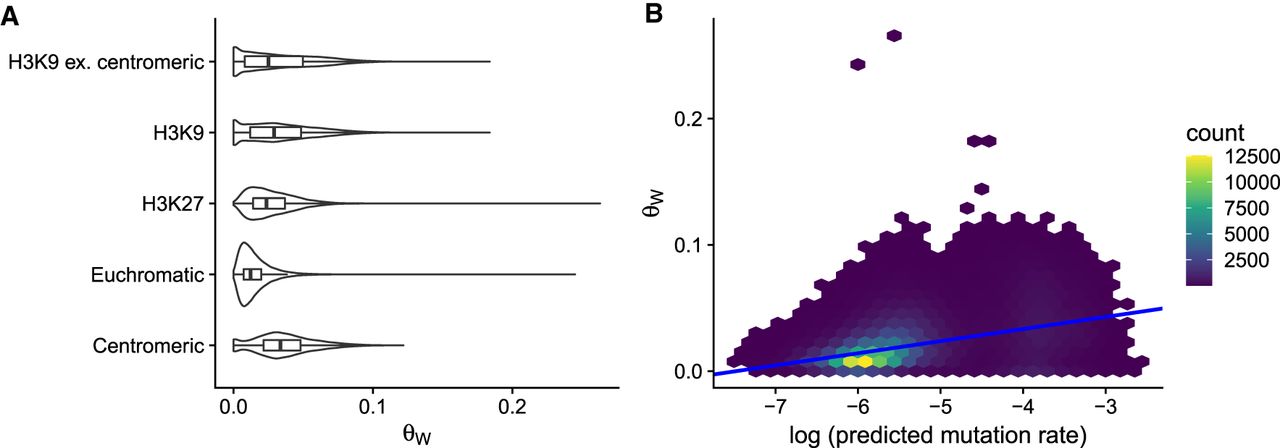
Figure 3.
Natural genetic diversity and mutation rate. (A) Nucleotide polymorphism, θW, was calculated across the genome in 200-bp windows, n = 202310. Violin plots overlaid with boxplots for the distribution of θW in different domains. (B) Relationship with θW and predicted mutation rate. For plotting, data were binned into hexes because of the high number of overlapping points, and the number of windows falling into each hex is shown by the legend.


