
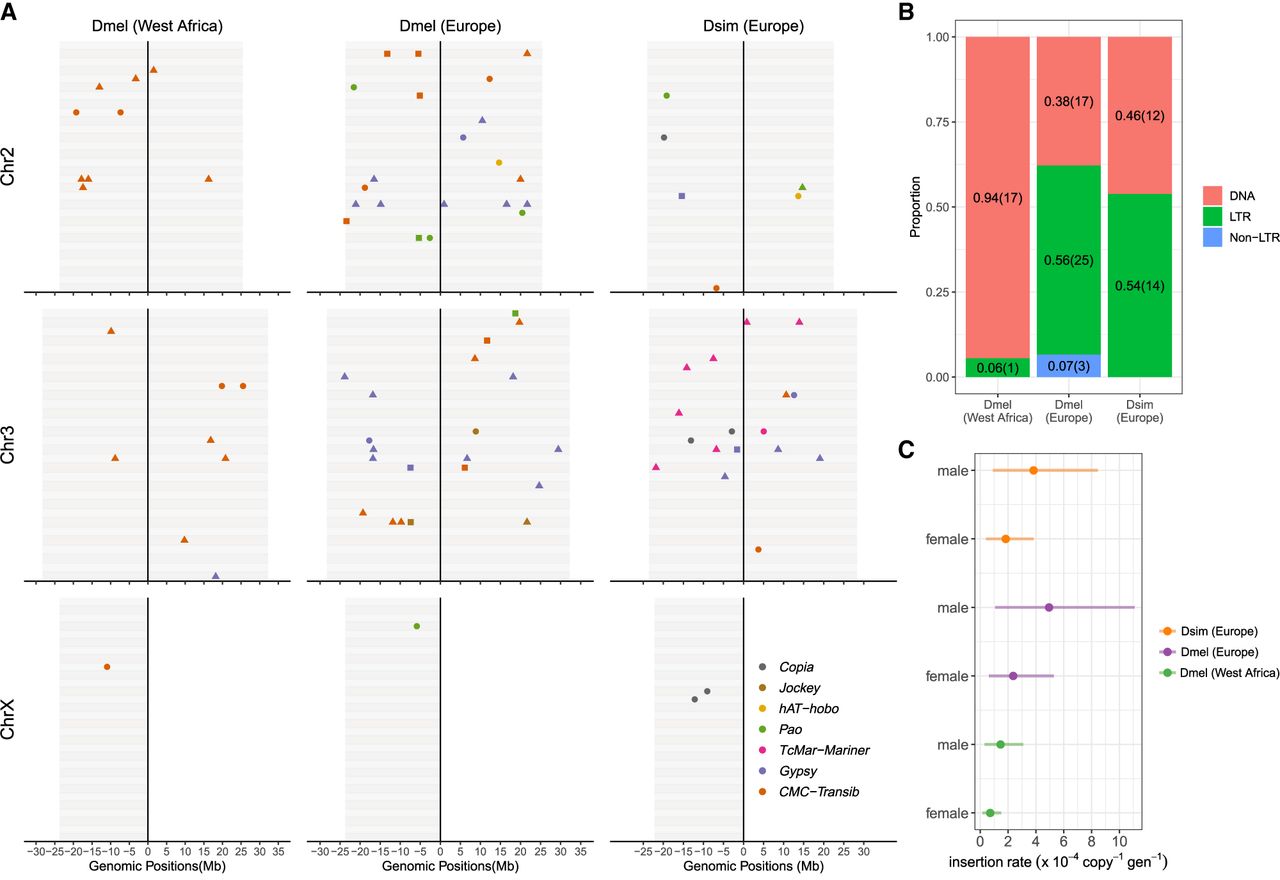
A summary of TE insertions in the three populations of Drosophila. (A) The genomic positions of the new TE insertions on chromosomes. Each gray bar represents an offspring individual, point color represents TE superfamilies, and point shape represents the parental origin of the insertion (triangle: paternal; circle: maternal; square: unknown). As above, insertions with unknown parental origin are shown as squares. (B) The proportion of new insertions of DNA elements, LTRs, and non-LTRs in the three populations. (C) The insertion rate (per copy per generation) and 95% CI estimated from a Bayesian GLMM in which “population” and “sex” were fixed effects and parental ID was a random effect.


