
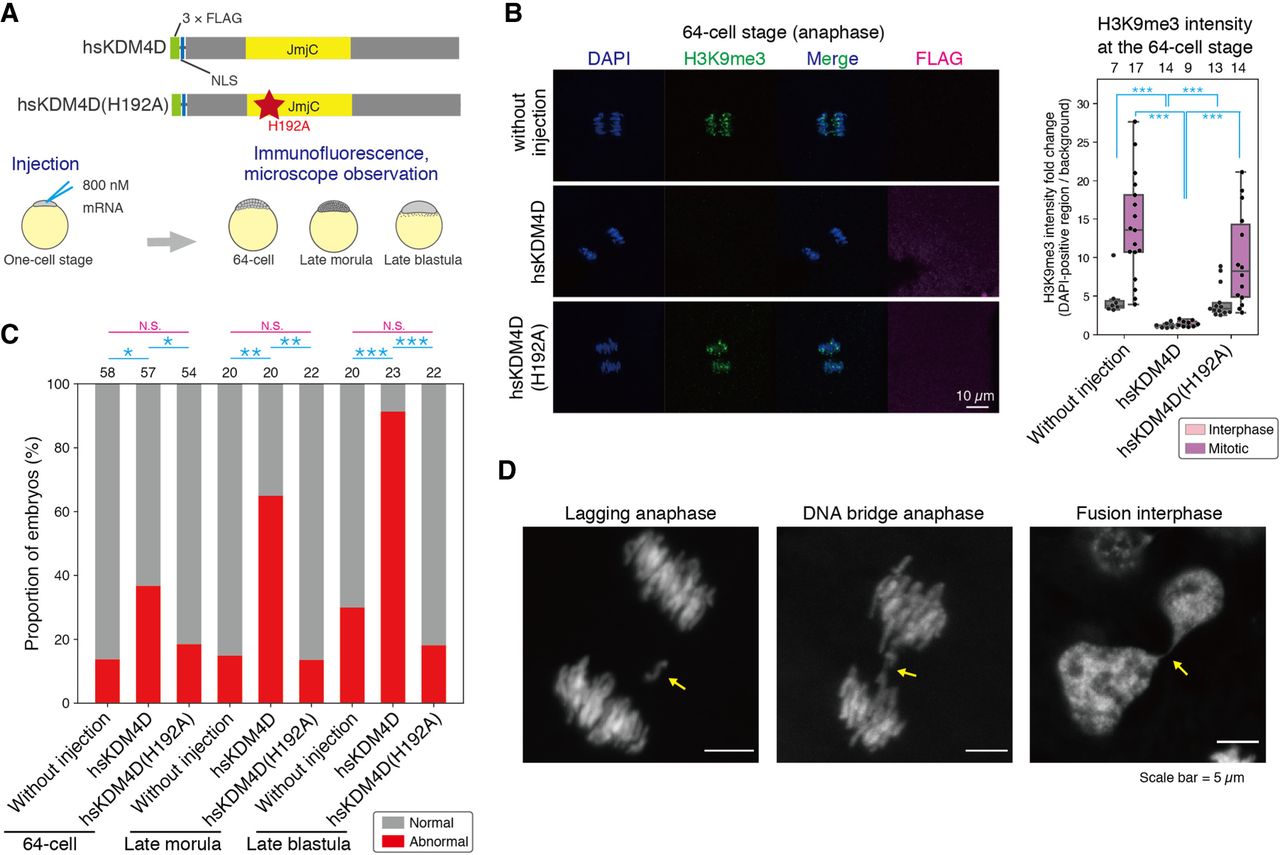
Removal of H3K9me3 increases genomic instability before ZGA. (A) Schematic illustrations of hsKDM4D constructs (wild-type hsKDM4D and its catalytically inactive point mutant hsKDM4D(H192A)) and experimental design. (B) Immunofluorescence staining of H3K9me3 during the mitotic phase (anaphase) at the 64-cell stage after injection of hsKDM4D or hsKDM4D(H192A) and its quantification. Boxplots showing the signal intensities of each histone modification in DAPI-positive regions. Each dot indicates the average intensity of 3–5 cells in a single broad field slice image of 64-cell embryo. The intensity was normalized by background intensity. The number above each plot indicates the number of embryos examined. Dwass, Steel, Critchlow, and Fligner all-pairs comparison test was performed. (C) Percentage of embryos having abnormal chromosome segregation phenotypes. The number above each bar shows the number of embryos examined in each condition. Two-sided Fisher's exact test was performed and P-values were normalized by the Holm method. (D) Representative phenotypes of chromosome segregation errors. Arrows indicate the error. (***) P < 0.001, (**) P < 0.01, (*) P < 0.05, respectively.


