
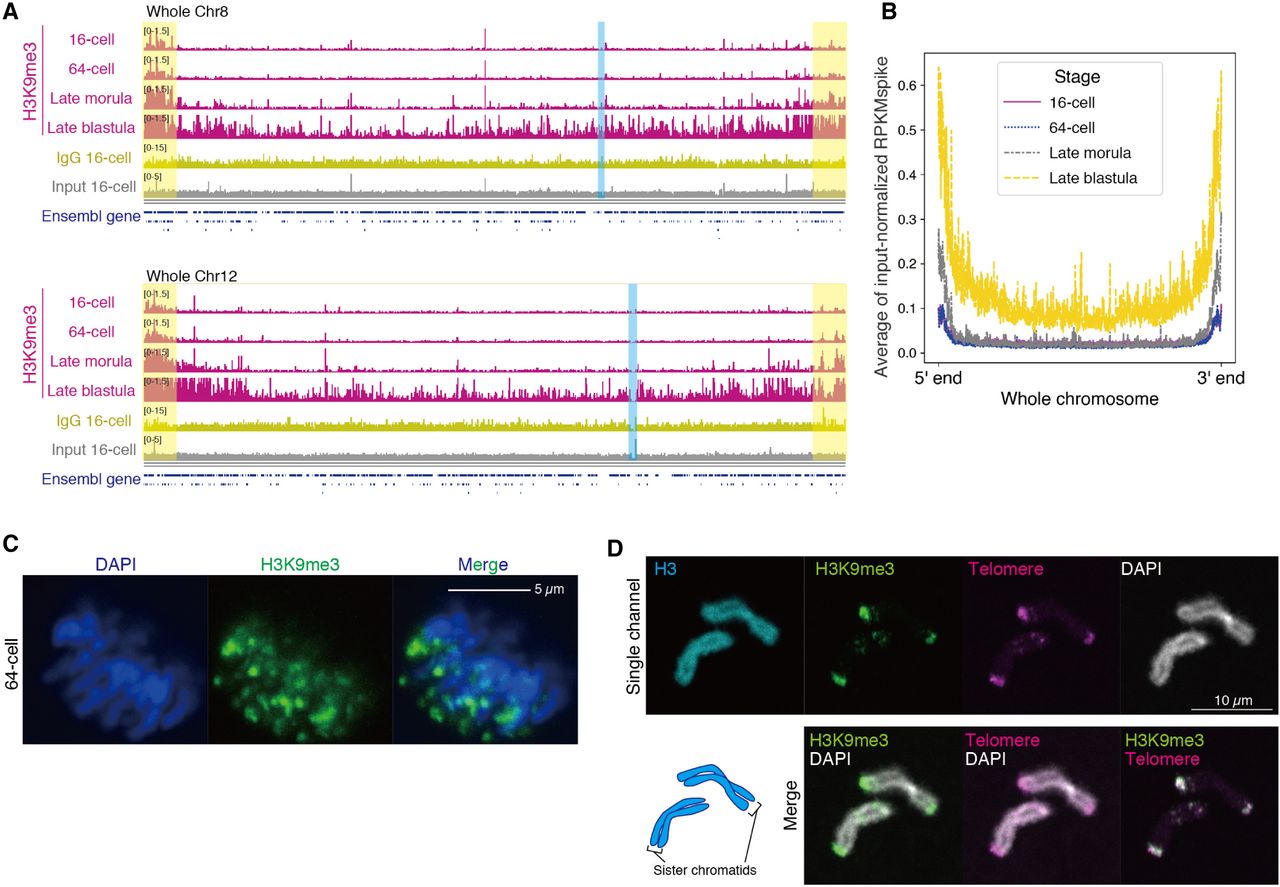
H3K9me3 at telomeric regions escapes reprogramming. (A) Track views showing H3K9me3, IgG, and input patterns on representative chromosomes. Whole Chromosome 8 and Chromosome 12 are shown. Ensembl genes are indicated as blue bars. Chromosome ends and centromere positions are highlighted in yellow and blue, respectively. (B) Average H3K9me3 signals on all chromosomes at four stages. To exclude the repeat bias, the signal was subjected to spike-in normalization and further normalized by input signal (see Methods). (C) Immunofluorescence staining of H3K9me3 during the mitotic phase (anaphase) at the 64-cell stage. (D) FISH and immunofluorescence staining using chromosome spreads from embryos at the 64-cell stage. Sister chromatids are shown as representatives.


