
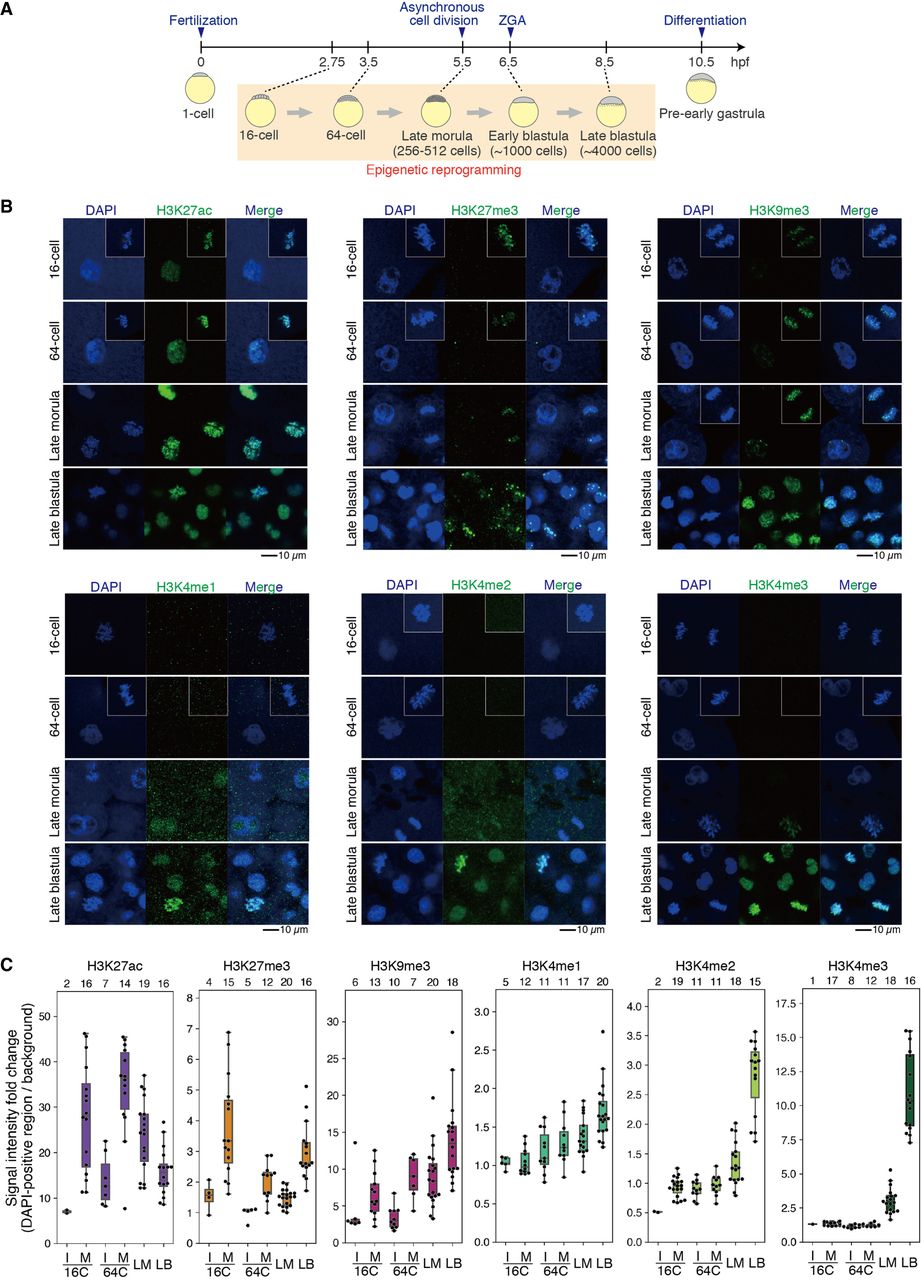
Erasure and retention of histone modifications before ZGA in medaka embryos shown by immunofluorescence staining. (A) A schematic of medaka development. (B) Immunofluorescence staining of medaka embryos at four stages. The nuclei during mitosis from other embryos are inserted in white boxes. The scale bar indicates 10 µm. (C) Boxplots showing the signal intensities of each histone modification in DAPI-positive regions. Each dot indicates the average intensity of 1–3, 3–5, ∼40, or ∼100 cells in a single broad field slice image of 16-cell (16C), 64-cell (64C), late morula (LM), or late blastula (LB) embryo, respectively. The intensity was normalized by background intensity. Interphase (I) and mitotic phase (M) embryos at the 16-cell and 64-cell stages are separately shown. Phases of cell cycle after the late morula stage are not shown because cells divide asynchronously and are mostly in interphase from the late morula stage. The number above each plot shows the number of embryos examined here.


