
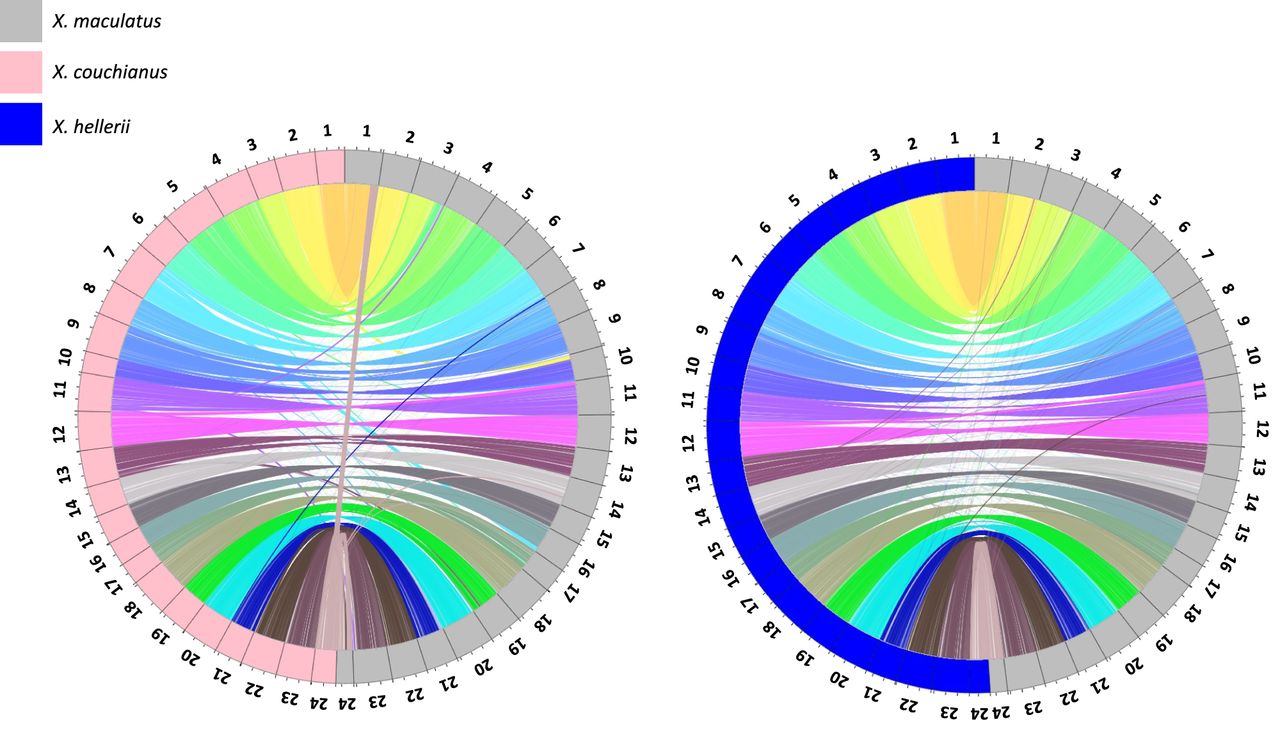
Figure 2.
Whole-genome synteny of Xiphophorus species. X. maculatus (XM; gray), X. couchianus (XC; pink), and X. hellerii (XH; blue) genome syntenic blocks are plotted as Circos plots. Outer rings represent chromosome lengths, with each tick representing 10 Mbp. Inner ribbons show gene orthology between XC and XM or between XH and XM. Orthologous genes between species are linked by lines in the Circos plot.


