
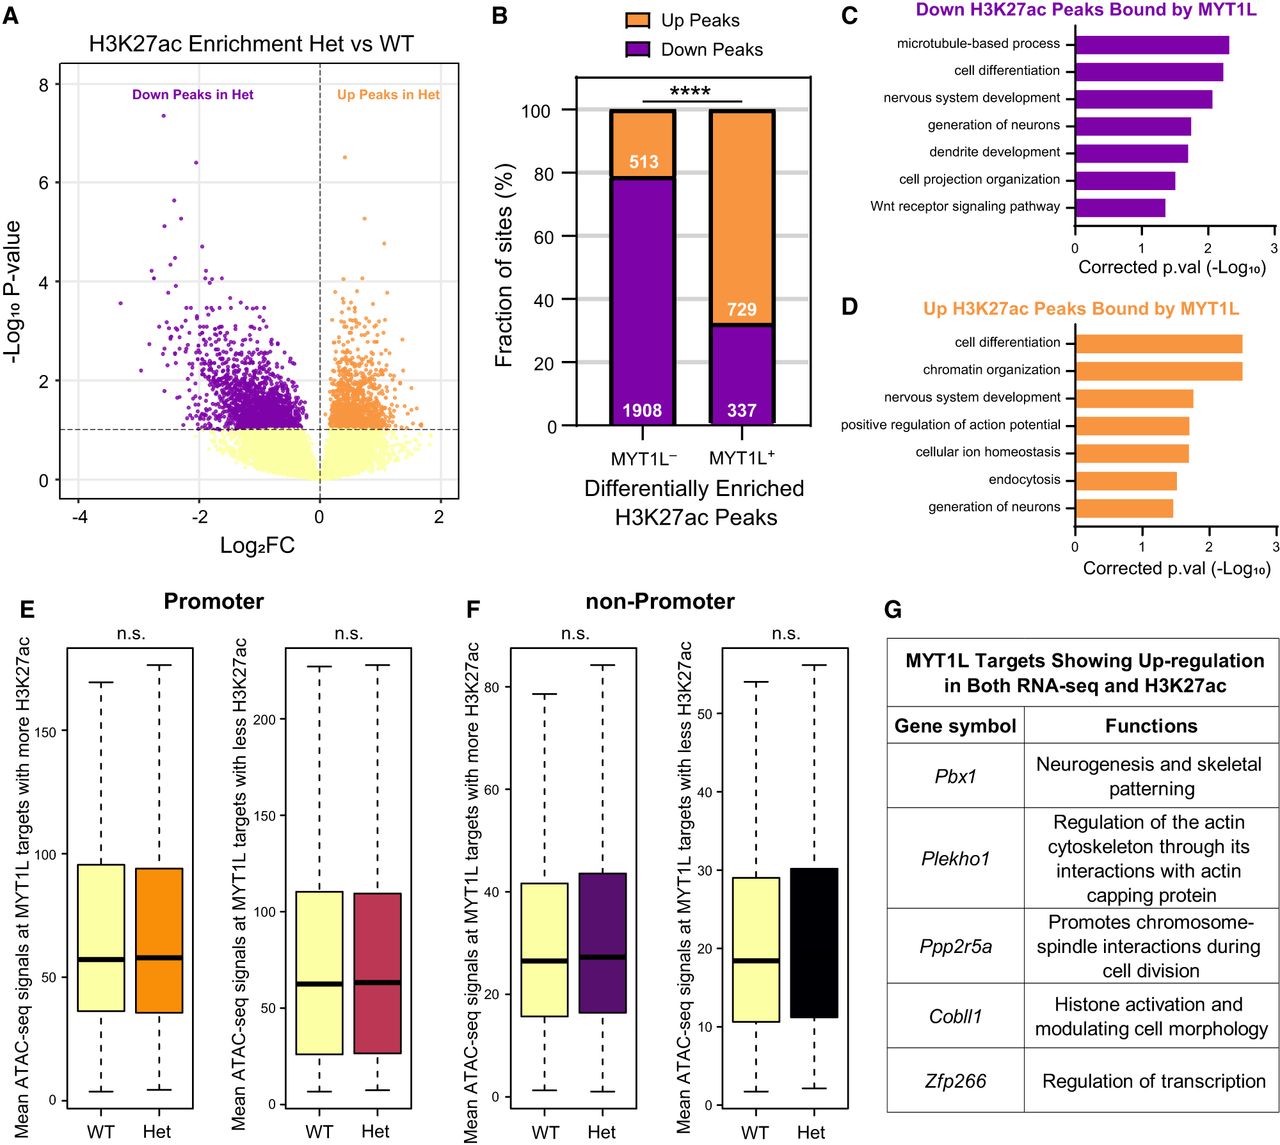
MYT1L loss alters the H3K27ac landscape across the genome. (A) Volcano plot showing differential enrichment analysis identified 3487 diff-H3K27ac peaks in Het PFC. (B) Distribution of down- and up-regulated diff-H3K27ac peaks within the non-MYT1L (MYT1L−) and MYT1L-bound (MYT1L+) categories. (****) P < 0.0001. (C) GO analysis on down-regulated diff-H3K27ac peaks bound by MYT1L and (D) up-regulated diff-H3K27ac peaks bound by MYT1L. (E) Mean ATAC-seq signals of MYT1L+ diff-H3K27ac promoter peaks (left: up-regulated peaks, right: down-regulated peaks). (F) Mean ATAC-seq signals of MYT1L+ diff-H3K27ac non-promoter peaks (left: up-regulated peaks, right: down-regulated peaks). (G) Functions of MYT1L targets showing up-regulation in both RNA-seq and H3K27ac.


