
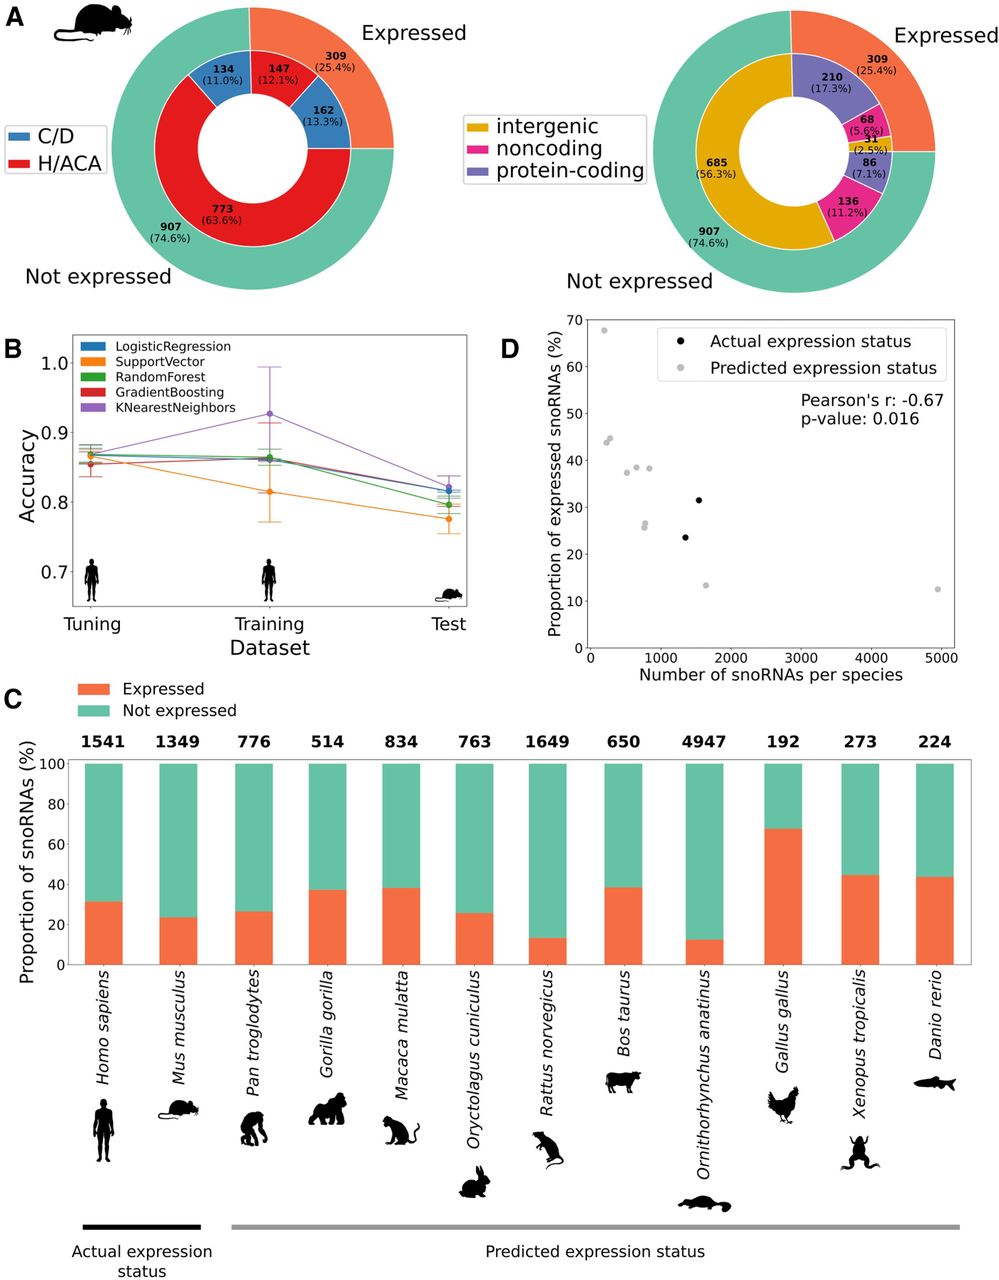
snoRNA expression status prediction in mouse and other vertebrates identifies a conserved low proportion of expressed snoRNAs. (A) Distribution of the number of snoRNAs per expression status (outer circle) according either to their type (inner circle in left panel) or genomic location (inner circle in right panel). (B) Average accuracy (±SD) of all models using only the top four features (box_consensus_ score, sno_stability, terminal_stem_stability, and host_expressed) on the tuning (10% of human snoRNAs), training (90% of human snoRNAs), and test (all mouse snoRNAs) sets across five random iterations of tuning/training data sets. (C) Proportion of expressed snoRNAs in humans and the mouse (actual expression status based on TGIRT-seq data sets) and for several vertebrate species (predicted expression status). The total number of snoRNAs per species is shown on top of each bar. (D) Proportion of expressed snoRNAs as a function of the total number of snoRNAs encoded within a species genome. The proportion of expressed snoRNAs is actually measured by TGIRT-seq for human and mouse; all other proportions are predicted using the logistic regression expression status predictor.


