
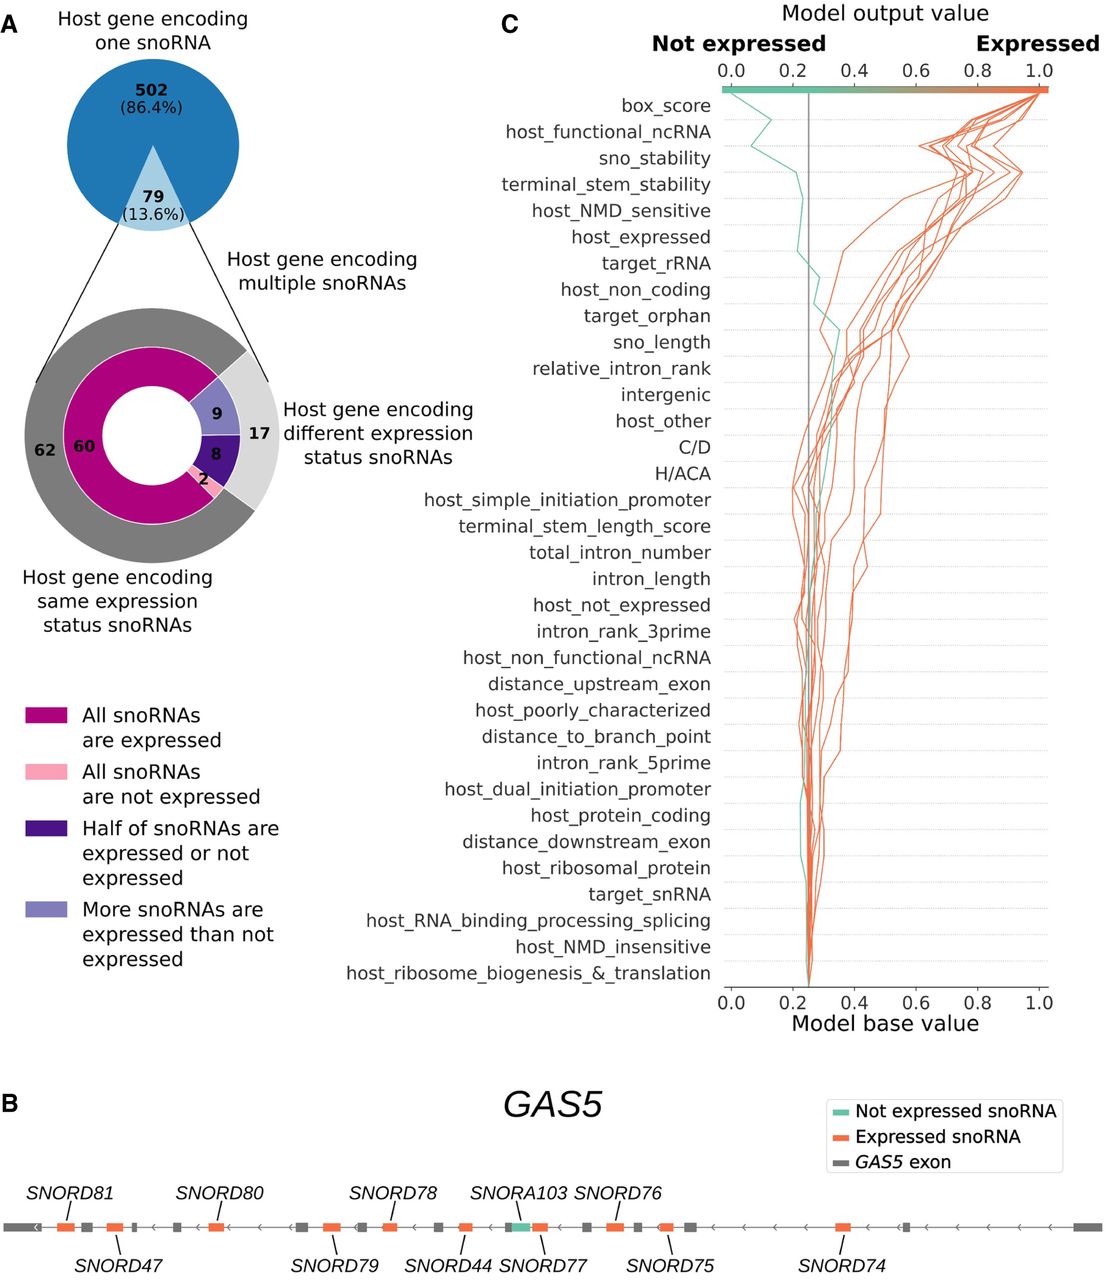
snoRNAs encoded within the same host gene, such as GAS5, can differ in expression status owing to their intrinsic features. (A) Distribution of the number of host genes encoding one or multiple snoRNAs within the same gene (top panel) and their corresponding expression status (bottom panel, outer layer) and consistency of expression status (bottom panel, inner layer). (B) Representation of the host gene GAS5 (exons shown as gray boxes) that encodes 10 expressed snoRNAs (orange boxes) and one nonexpressed snoRNA (turquoise box). (C) Decision plot of the support vector machine classifier showing the relative contribution (SHAP value) of each feature in the decision process of predicting the expression status of each GAS5 embedded snoRNAs (where each individual line traced toward either the “expressed” or “not expressed” output represents one snoRNA).


