
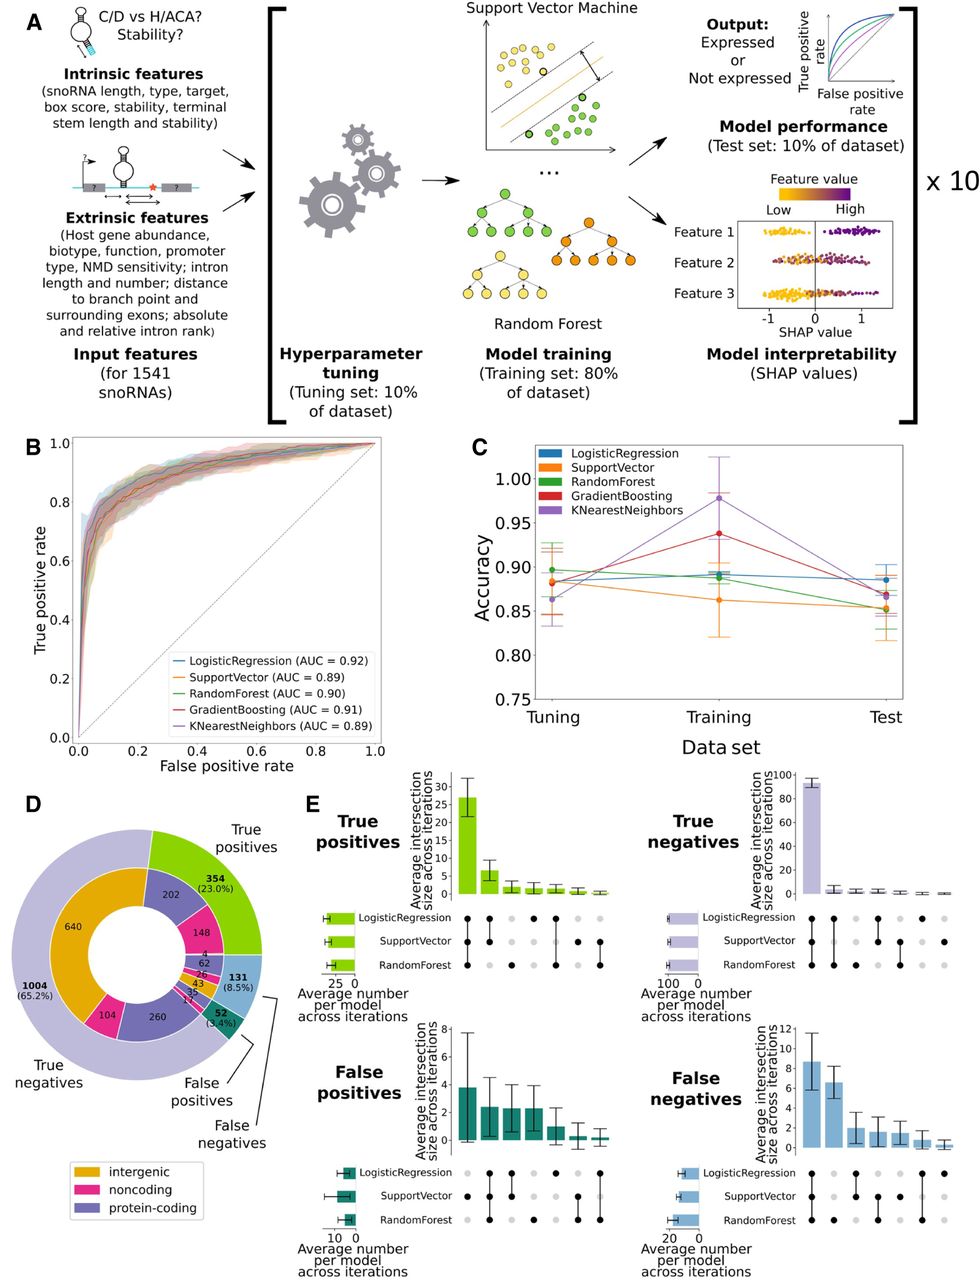
All models predicting snoRNA expression status are highly performant and concordant. (A) Features were collected for all human snoRNAs and used to optimize the hyperparameters of each model. The optimized models were then trained (only the support vector machine and random forest classifiers are represented) and tested, and their decisions were interpreted using Shapley additive explanations (SHAP values). This process was repeated across 10 randomized data set splits (iterations), ensuring one expression status prediction for each snoRNA. (B) Receiver operating characteristic (ROC) curves showing the average true- and false-positive rates of each model on the test sets (the colored areas around each curve represent ±1 SD across the 10 iterations). The average area under the curve (AUC) is shown for each classifier. (C) Average accuracy (±SD) of each model on the tuning, training, and test sets across the 10 iterations. (D) Distribution of the number of snoRNAs based on their predicted value. A snoRNA is considered as, for example, a true positive when at least two of the three selected models predict it as such. (E) Average intersection of predictions (±SD) between all models for the different prediction types across the 10 iterations.


