
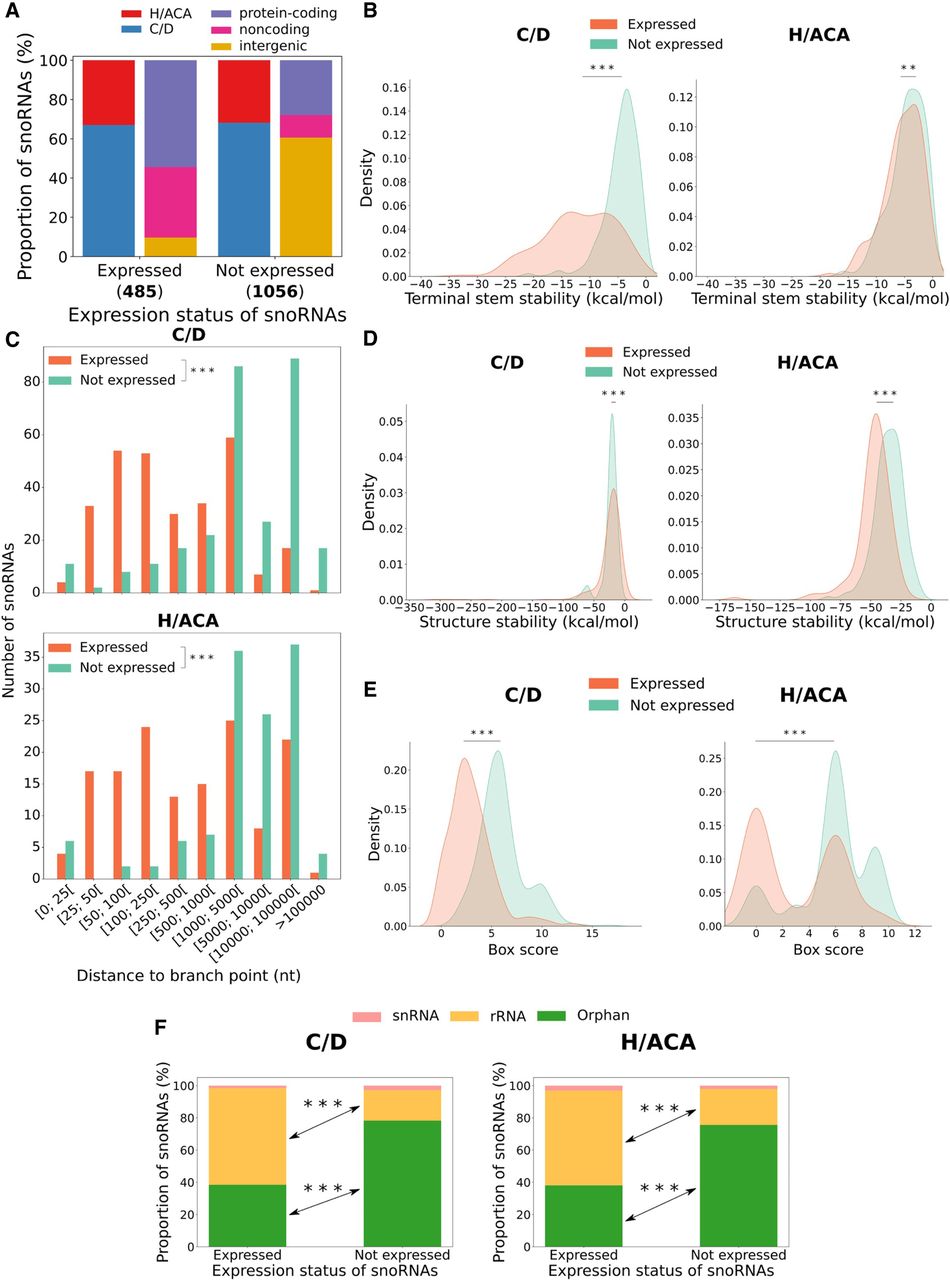
Characterization of human snoRNA features according to their expression status. (A) Proportion of expressed and not expressed snoRNAs as a function of the snoRNA type (left bar of each pair) and the host gene biotype (right bar of each pair). The number of expressed and not expressed snoRNAs are displayed in parentheses under the bars. (B) Distribution of terminal stem stability (in kcal/mol) for C/D and H/ACA box snoRNAs per expression status. The distributions are statistically different: Mann–Whitney U test; (***) P < 8 × 10−79 and (**) P < 0.01, respectively, for C/D and H/ACA box snoRNAs. (C) Distribution of the number of expressed and nonexpressed intronic snoRNAs per snoRNA type according to their distance to the branchpoint: Mann–Whitney U test; (***) P < 6 × 10−80 and (***) P < 8 × 10−36 for C/D and H/ACA box snoRNAs, respectively. (D) Distribution of the snoRNA structure stability (in kcal/mol) per expression status and snoRNA type: Mann–Whitney U test; (***) P < 0.001 and (***) P < 2 × 10⁻²³ for C/D and H/ACA box snoRNAs, respectively. (E) Distribution of snoRNA box score depending on the expression status and snoRNA type: Mann–Whitney U test; (***) P < 4 × 10−80 and (***) P < 4 × 10⁻¹⁹, respectively, for C/D and H/ACA box snoRNAs. (F) Bar charts displaying the proportion of snoRNAs per expression status for C/D (left panel) and H/ACA box (right panel) snoRNAs according to their target: Fisher's exact test; (***) P < 2 × 10−38 and (***) P < 4 × 10⁻¹⁵ for C/D and H/ACA box snoRNAs, respectively.


