
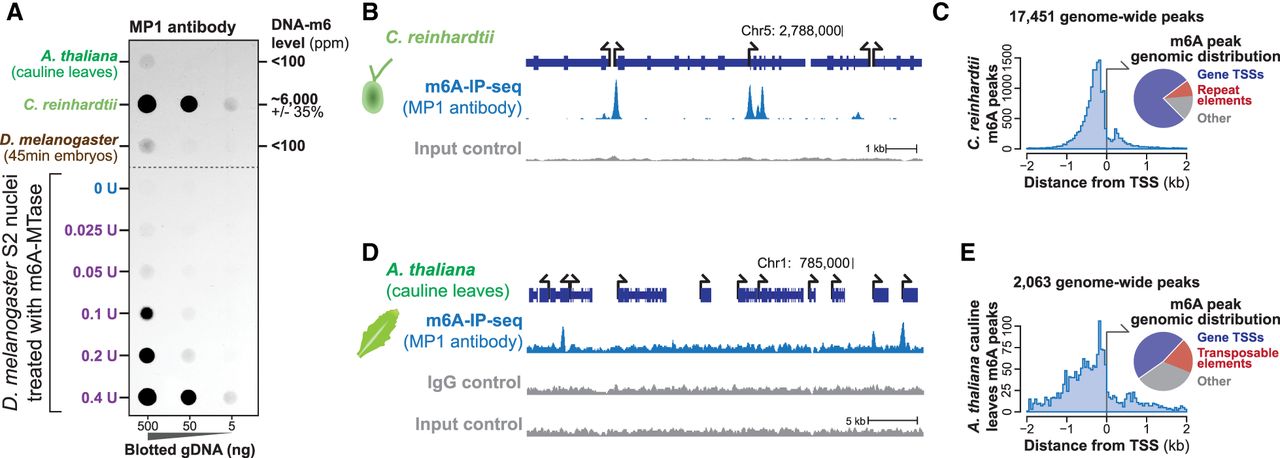
Detection of endogenous DNA-m6A across three nonmammalian eukaryotes. (A) DNA dot-blot quantifying the relative amount of DNA-m6A in samples from three eukaryotes, as well as from S2 cell nuclei treated with increasing amounts of m6A-MTase. To the right are the observed amount of DNA-m6A in samples relative to Figure 1D. (B) Genomic locus from C. reinhardtii comparing the relationship between m6A-DIP-seq signal and input control signal. The y-axis is identical for both experiments. (C) Histogram (left) and pie chart (right) showing the distribution of identified C. reinhardtii DNA-m6A peaks relative to TSSs and repetitive elements. (D) Genomic locus from A. thaliana comparing the relationship between m6A-DIP-seq signal and input and IgG control signal. The y-axis is identical for all experiments. (E) Histogram (left) and pie chart (right) showing the distribution of identified A. thaliana DNA-m6A peaks relative to TSSs and repetitive elements.


