
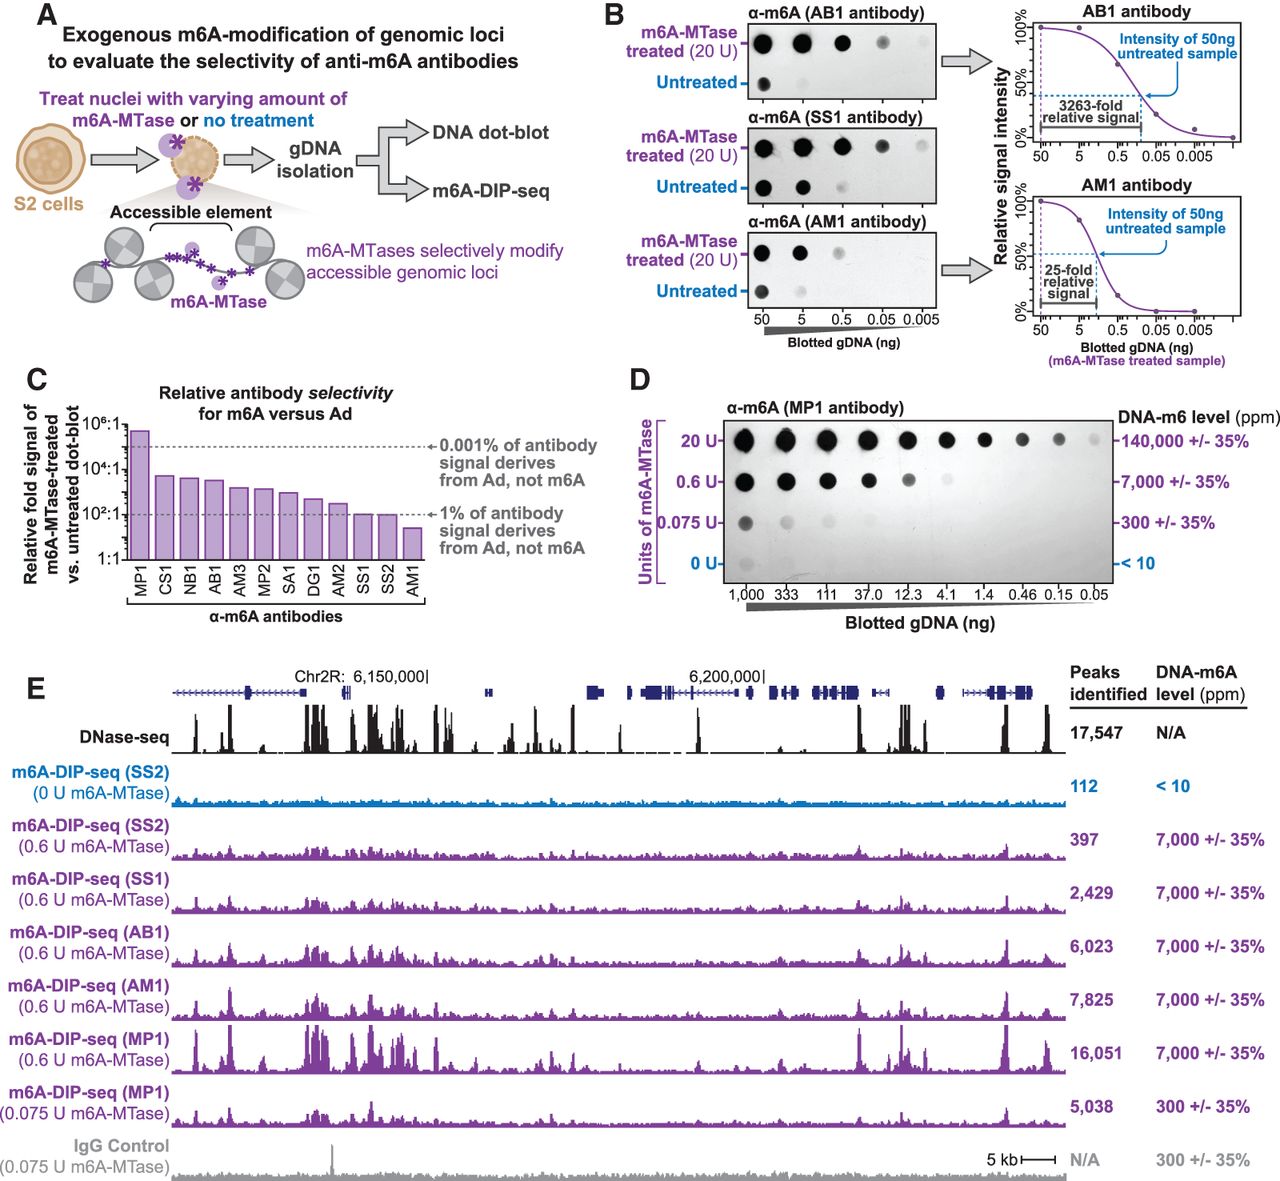
Sensitivity and selectivity of anti-DNA-m6A antibodies. (A) Schematic for assaying anti-DNA-m6A antibody selectivity and sensitivity using gDNA isolated from cell nuclei exogenously methylated with a nonspecific DNA m6A-MTase. (B) DNA dot-blots using three separate anti-DNA-m6A antibodies against gDNA from untreated S2 cells versus gDNA from S2 cells treated with m6A-MTase. To the right are quantifications of DNA dot-blot signal intensity for the 20-unit treated sample, a four-parameter log-logistic fit to these signals (purple line), and the relative signal intensity of the untreated 50-ng sample as opposed to the treated sample. (C) Bar chart quantifying the relative selectivity of each anti-DNA-m6A antibody toward DNA-m6A, as measured using DNA dot-blots. (D) DNA dot-blot and table showing the relative amount of DNA-m6A after treatment of S2 cell nuclei with increasing amounts of a nonspecific DNA-m6A-MTase. (E) Genomic locus comparing the relationship between DNase-seq and m6A-DIP-seq signal. m6A-DIP-seq performed using five separate antibodies on untreated S2 cell gDNA, or gDNA from S2 cell nuclei treated with 0.6 U or 0.075 U of m6A-MTase. Signal from IgG antibody control also displayed. The y-axis is identical for all m6A-DIP-seq and DNase-seq experiments.


