
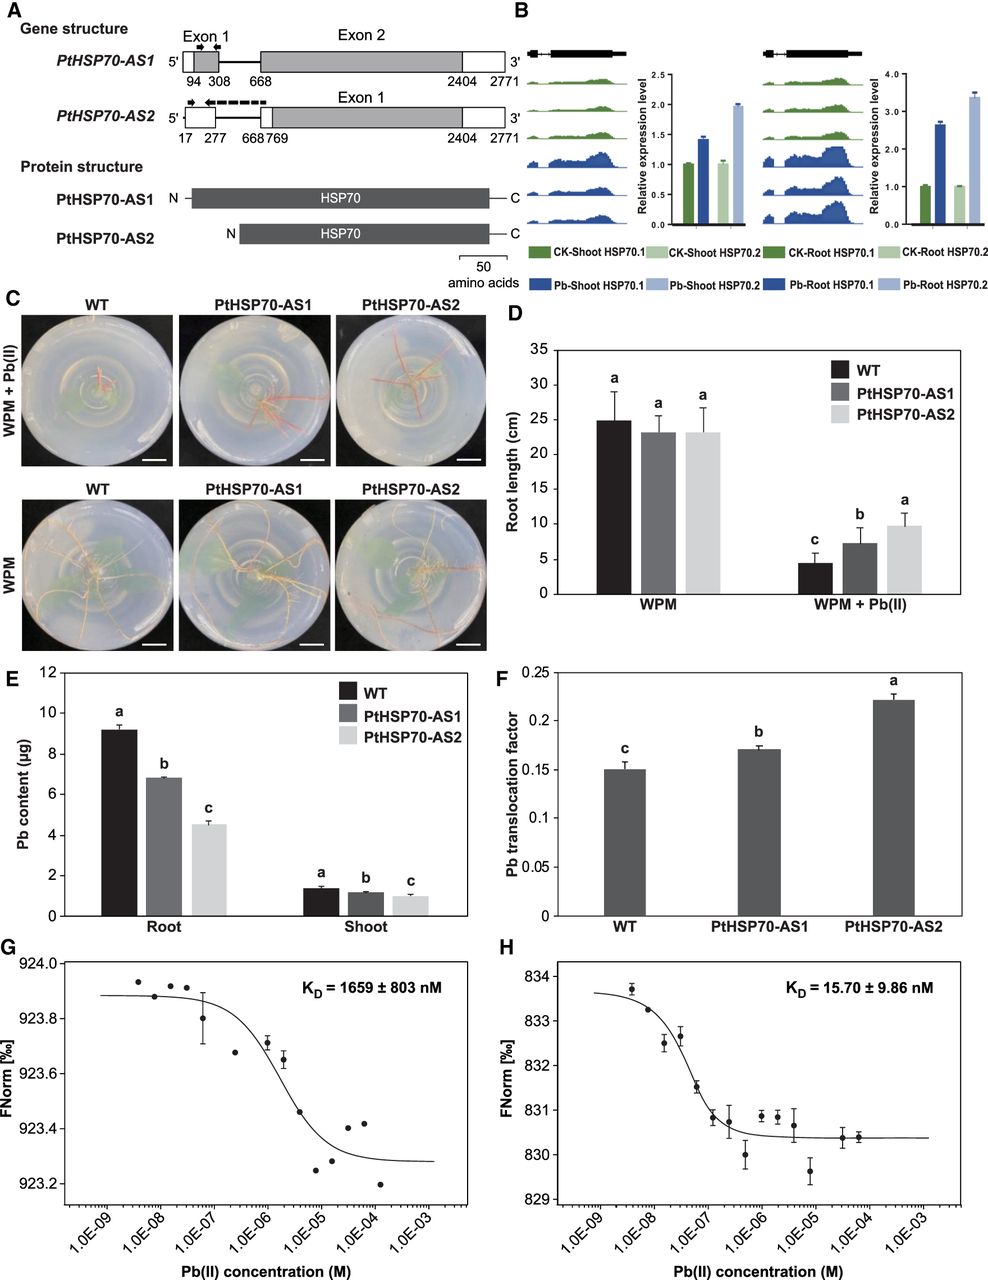
Gene and protein structure and expression of PtHSP70, and phenotypic analysis of transgenic poplar overexpressing PtHSP70-AS1 and PtHSP70-AS2. (A) Gene and protein structures of PtHSP70-AS1 and PtHSP70-AS2. Dotted line, the reverse primer of PtHSP70-AS2 is a splicing junction primer that span the intron. The reverse primer of PtHSP70-AS1 starts at the exon which PtHSP70-AS2 does not have. (B) RNA-seq read mapping data for RefSeq annotated gene regions for PtHSP70 and the expression of PtHSP70-AS1 and PtHSP70-AS2 in wild-type poplar treated and not treated with Pb. (C) Phenotype of transgenic poplar overexpressing PtHSP70-AS1 and PtHSP70-AS2 after Pb treatment. (D) Root length of transgenic poplar overexpressing PtHSP70-AS1 and PtHSP70-AS2 after Pb treatment. (E) Pb contents of transgenic poplar overexpressing PtHSP70-AS1 and PtHSP70-AS2 after Pb treatment. (F) Pb translocation factors of transgenic poplar overexpressing PtHSP70-AS1 and PtHSP70-AS2 after Pb treatment. The letters represent significant differences between the WT and transgenic lines (ANOVA, P < 0.05). CK, control sample grown in the absence of Pb; Pb, sample grown in the presence of Pb; WT, wild type; PtHSP70-AS1, transgenic poplar overexpressing PtHSP70-AS1; PtHSP70-AS2-1, transgenic poplar overexpressing PtHSP70-AS2. (G,H) Binding affinity between Pb(II) and recombinant PtHSP70-AS1 (G) and PtHSP70-AS2 (H) determined by MST binding assay. The values represent the means ± SDs (n = 3).


