
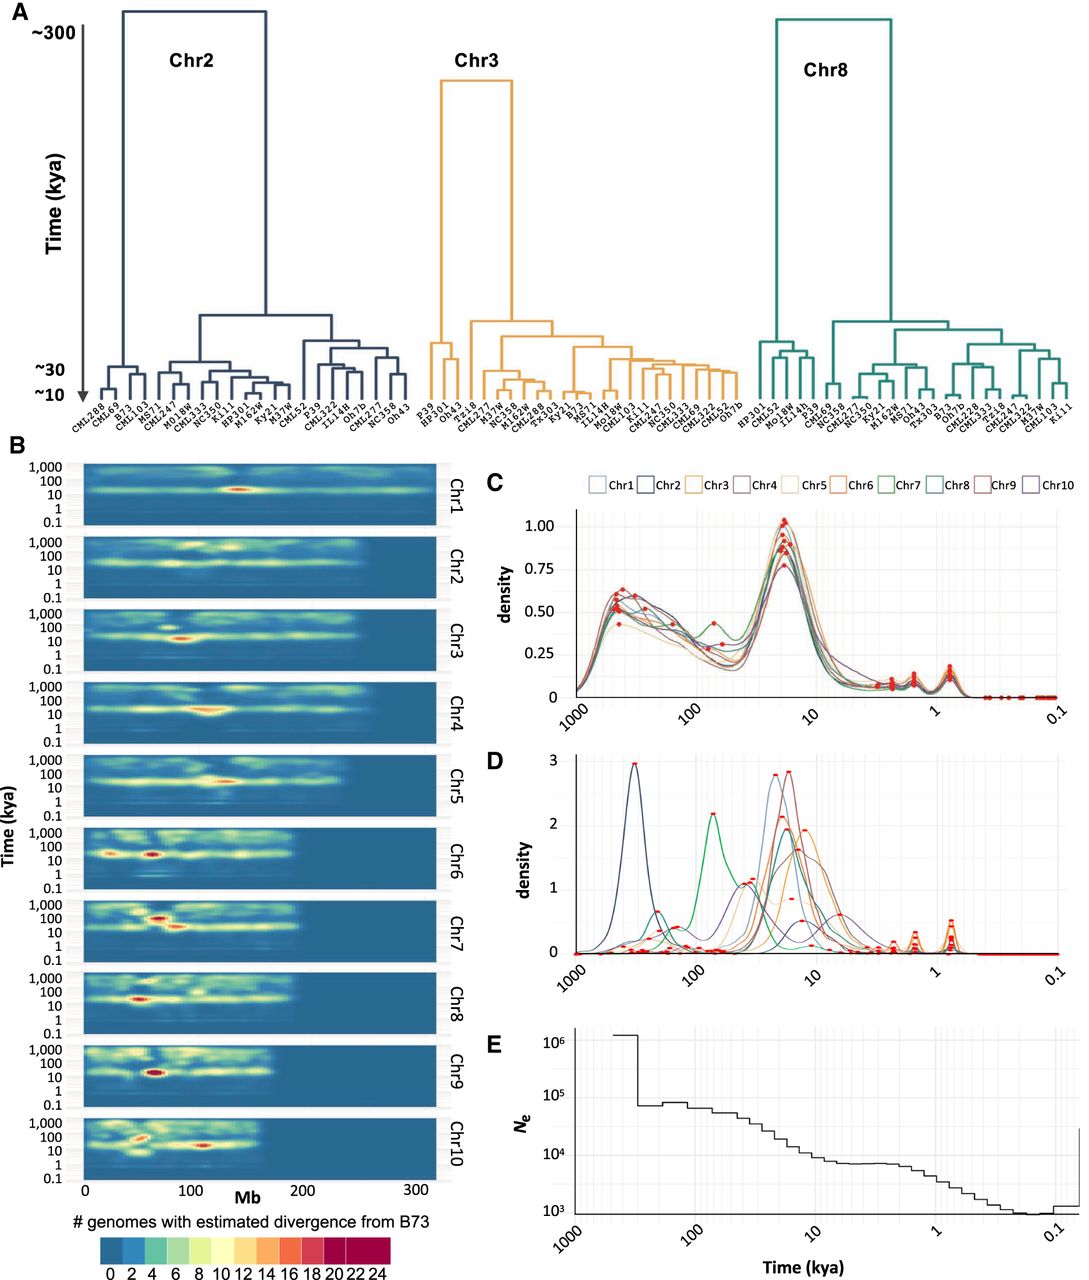
Whole-genome age distributions. (A) Hierarchical clustering of cenhaps from three chromosomes showing that most cenhap diversity dates to 10–30 kya. (B) Divergence times of intergenic spaces estimated from 20-kb windows represented in a density plot. (C) Density plot of all divergence times displayed in B. The x-axis shows probability densities, where the total area under the curve is 1. Local maxima are highlighted as red dots. When the B73 haplotype is compared to similar haplotypes, there is good alignment and few SNPs, giving discrete young peaks on the right of the curve (at ∼2.4, 1.6, and 0.8 kya, representing windows with 3, 2, or 1 SNP). When B73 is compared to more divergent haplotypes, there are more SNPs and the aligned regions may be smaller due to the presence of SVs (such as a deletion). In these cases, the denominators change to the size of the alignable sequence, causing the age distribution to become more continuous at older ages. (D) Density plot of cenhap divergence times only, annotated as in C. The two large peaks at older age represent cases where the B73 cenhap is in the minority group and diverged from most other cenhaps ∼220 kya (Chr 2) or ∼60 kya (Chr 7). (E) Effective population size (Ne) of maize over the past 0.5 million yr.


