
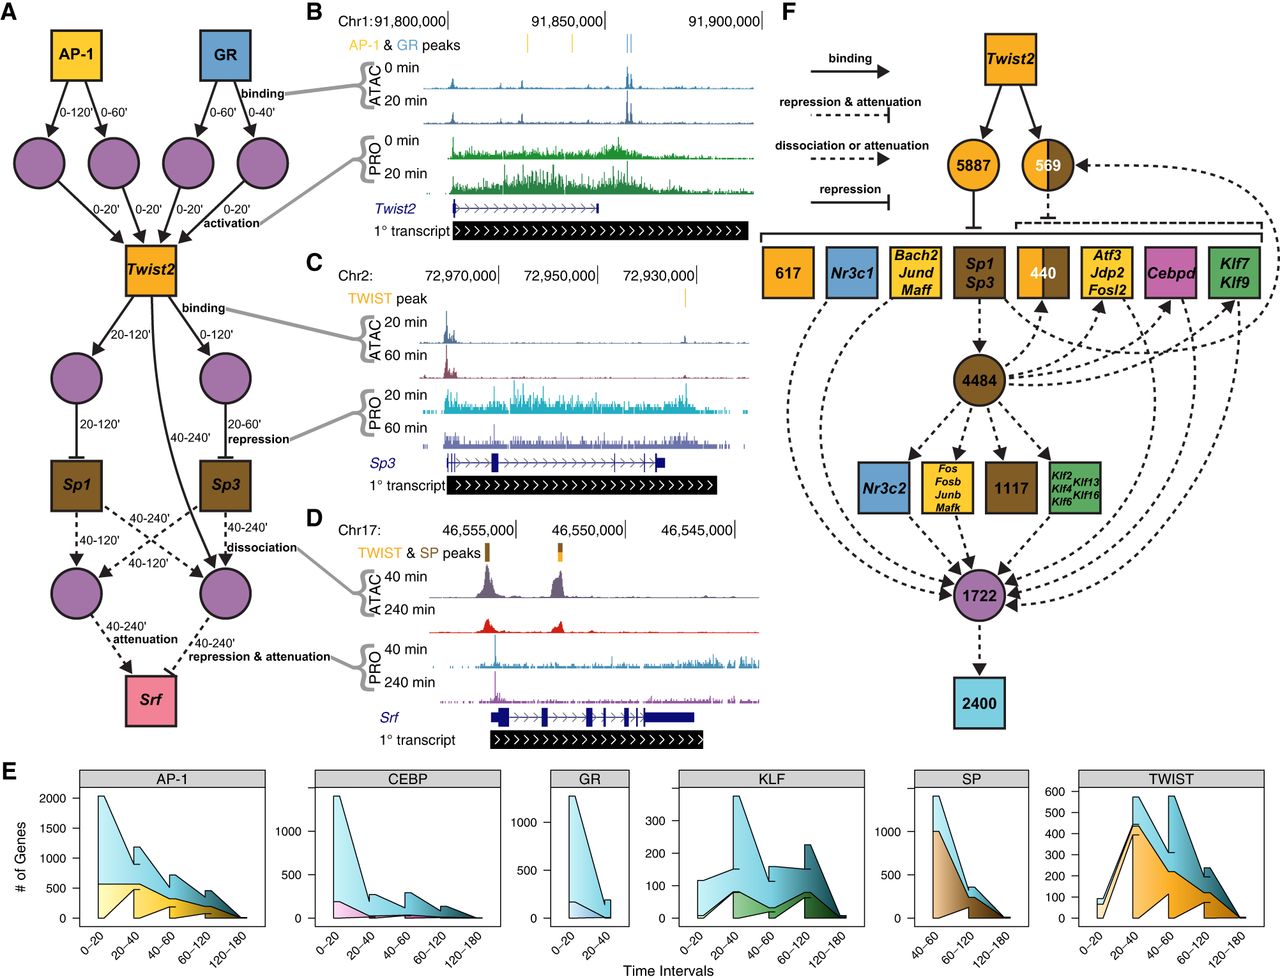
Variations in TF gene expression lead to downstream changes in accessibility and transcription. (A) A deep network highlights temporal components of the regulatory cascade. Node and edge characteristics are illustrated as in Figure 4. In addition, we added time interval attributes to respective edges to indicate when REs and genes are changing. (B–D) UCSC Genome Browser shots indicate accessibility and peaks (top three tracks), as well as nascent transcription (next two tracks) dynamics between the indicated time points. (E) Wedged bar plots quantify the regulatory kinetics across the time course for indicated factors. The x-axis intervals represent the time range in which the indicated number (y-axis) of genes are regulated (connected in the network) by the specified factor. Wedges between bars indicate carryover elements from previous time interval, and the outer “wings” represent elements that are not included in the previous time interval. The top shaded blue wedges represent genes regulated by multiple factors; bottom wedges represent genes that are solely regulated by the indicated factor. (F) A Twist2-centric network illustrates the high connectivity and influence of Twist2.


