
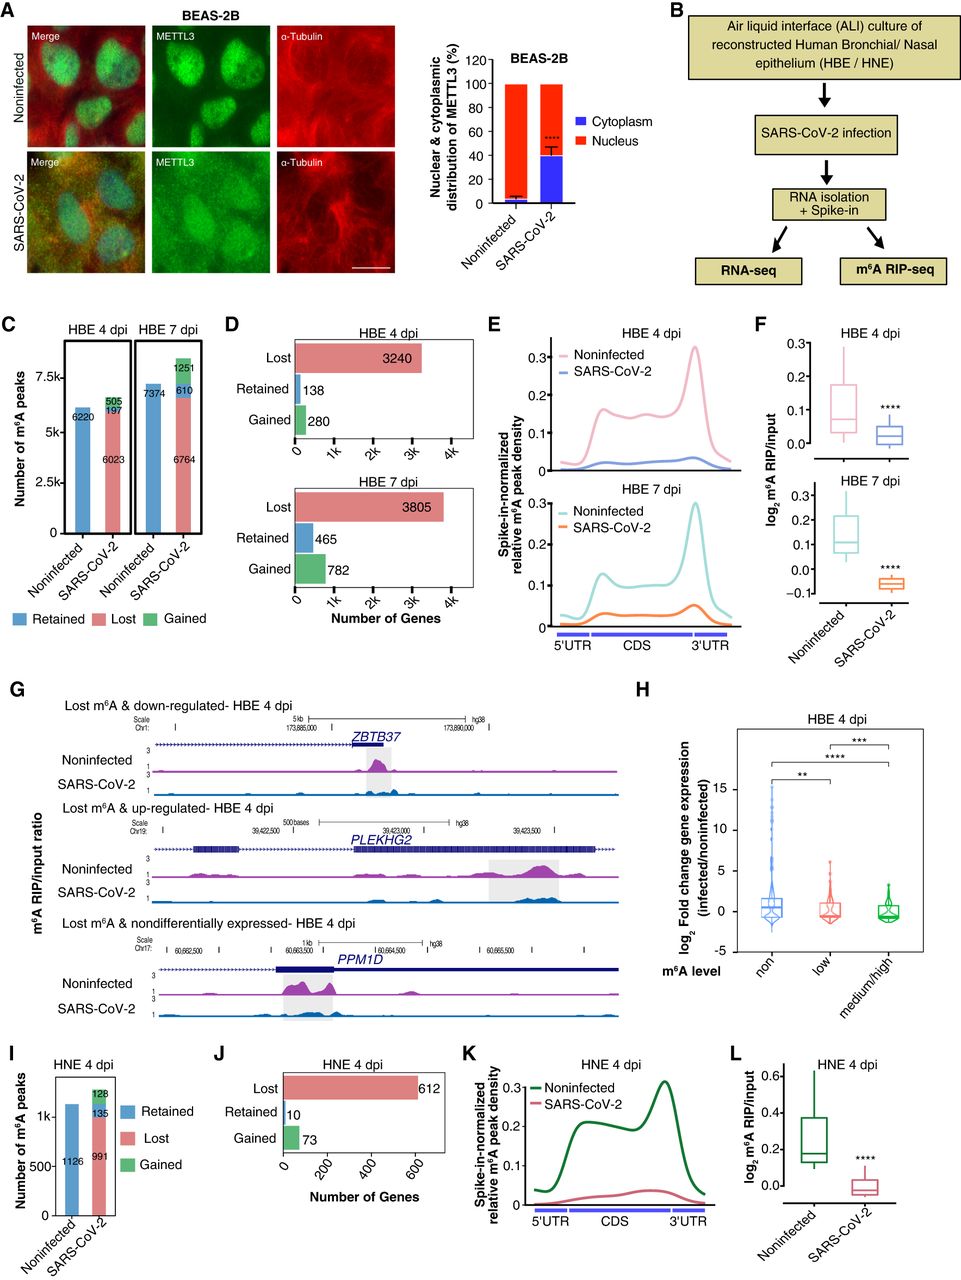
Loss of m6A in human airway epithelia after SARS-CoV-2 infection. (A, left) METTL3 localization in BEAS-2B cells postinfection with SARS-CoV-2. The scale bar is 20 μm. (A, right) The percentage distribution of METTL3 in the nucleus and cytoplasm was calculated using ImageJ with help of DAPI marking the nucleus and α-tubulin staining the cytoplasm. Data are shown as mean ± SD. Data presented from multiple experiments with the number of cells counted, n = <300. Unpaired t-test; (****) P < 0.0001. (B) Flow chart describing the experimental design for SARS-CoV-2 infection of reconstructed human bronchial/nasal epithelium at ALI. (C) Total number of m6A peaks classified as retained, gained, or lost, after 4- or 7-d post infection (dpi) with SARS-CoV-2, compared with noninfected HBE. (D) Bar plots representing the number of genes that lost, gained, or retained m6A in HBE after 4 and 7 dpi. (E) Metagene plots showing spike-in normalized relative m6A peak density distribution at host genes in noninfected and SARS-CoV-2-infected HBE cells at 4 and 7 dpi. (F) Boxplot showing log2 ratio of m6A signal over input obtained from spike-in normalized CPM data at lost m6A peak regions (±125 bp from m6A peak submit) taken from panel C at 4 and 7 dpi in HBE. Statistical significance was calculated using the Wilcoxon test; (****) P < 0.0001. (G) Genome browser screenshots showing the ratio of m6A RIP/input for three different genes in noninfected and SARS-CoV-2-infected HBE at 4 dpi. Ratio tracks were calculated using spike-in normalized CPM. m6A peak region identified using MACS peak caller in noninfected cells are highlighted using the gray box. (H) log2 fold-change distributions of differentially expressed genes in HBE at 4 dpi, categorized according to their m6A level: non, low, medium/high. Statistical significance was calculated using the Wilcoxon test; (**) P < 0.01, (***) P < 0.001, (****) P < 0.0001. (I) Total number of m6A peaks classified as retained, gained, or lost, after 4 dpi with SARS-CoV-2 compared with noninfected HNE. (J) The number of genes that lost, gained, or retained m6A in HNE post-SARS-CoV-2 infection. (K) Metagene plots showing spike-in normalized relative m6A peak density distribution in noninfected and SARS-CoV-2-infected HNE. (L) Boxplot showing log2 ratio of m6A signal over input obtained from spike-in normalized CPM data at lost m6A peak regions (±125 bp from m6A peak submit) taken from panel I at 4 dpi in HNE. Statistical significance was calculated using the Wilcoxon test; (****) P < 0.0001.


