
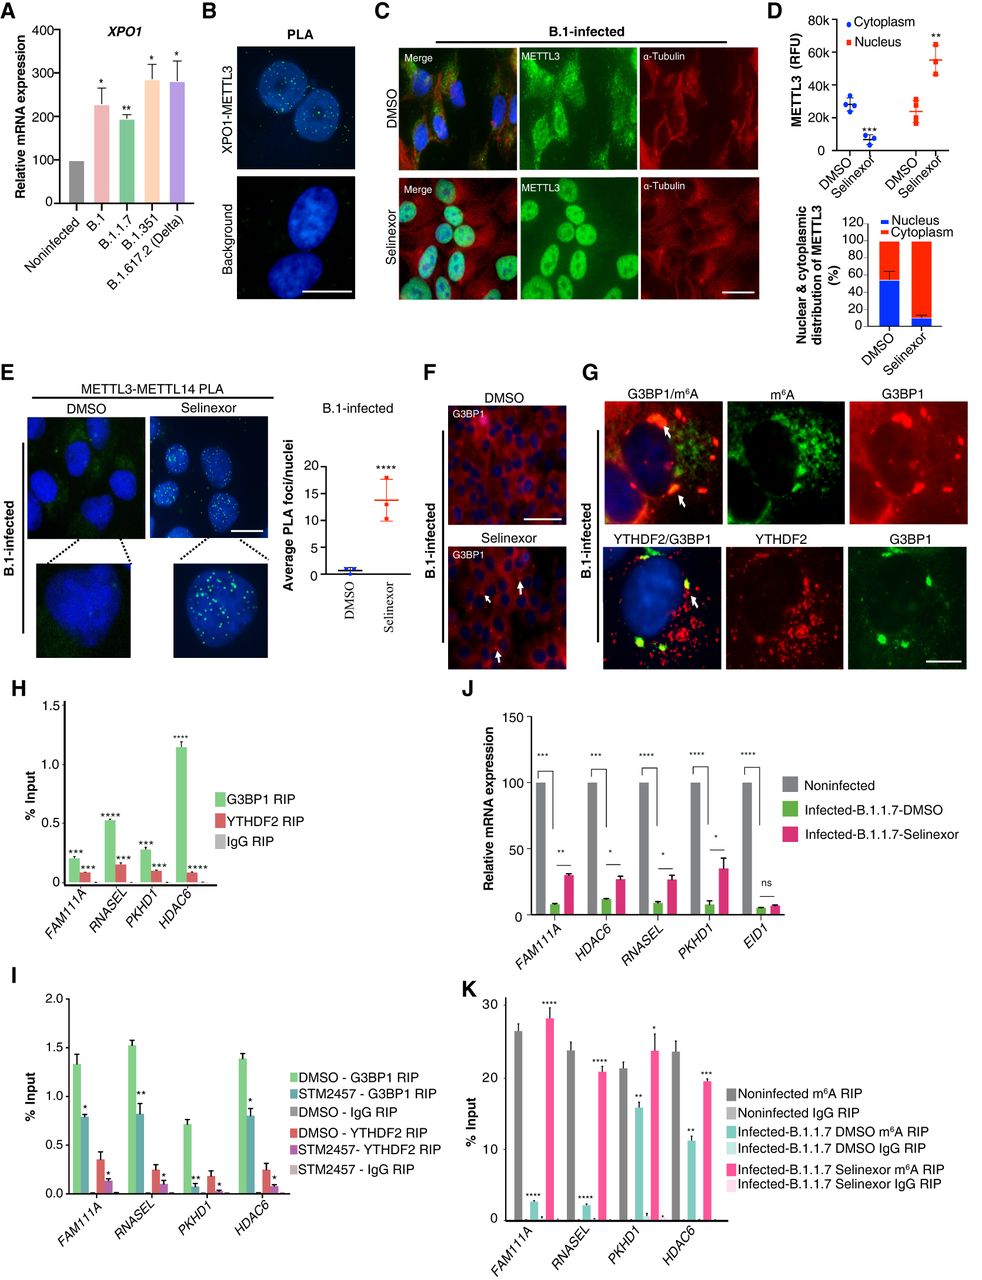
Treatment with selinexor restores METTL3 cellular localization during viral infection. (A) Relative expression of the XPO1 gene evaluated post-SARS-CoV-2 infection (variants as specified) using RT-qPCR. Data were normalized to TBP and POL2RG. Two-tailed t-test; (*) P < 0.05, (**) P < 0.01, n = 3. (B, top) PLA in noninfected Vero cells depicting interacting XPO1 and METTL3 foci. (Bottom) Background control for PLA with only XPO1 antibody. Scale bar is 20 μm. (C,D) Rescue of METTL3 localization. (C) METTL3 and α-tubulin coimmunostaining in Vero cells postinfection (24 h) with B.1 SARS-CoV-2 that were either treated with DMSO or selinexor (150 nM). Scale bar is 20 μm. (D, top) METTL3 intensities (RFU) from the immunostaining performed in C. METTL3 (RFU) in the nucleus and cytoplasm were estimated using ImageJ with help of DAPI marking the nucleus and α-tubulin staining the cytoplasm. Data are shown as Mean ± SD. Data presented from multiple experiments with number of cells counted, n = <70. One-way ANOVA test was performed; (**) P < 0.01, (***) P < 0.001. (D, bottom) Percentage of METTL3 distribution in nucleus and cytoplasm calculated from intensities from the upper panel. (E, top) PLA depicts interacting METTL3 and METTL14 foci in the nucleus (marked by DAPI) of Vero cells infected with B.1 SARS-CoV-2 variants and treated with either DMSO or selinexor (150 nM). Scale bar is 20 μm. (E, bottom) Quantification of METTL3–METTL14 PLA foci as detected in the above panel. The number of PLA foci/nuclei are shown as mean ± SD. Data presented from multiple experiments with number of cells counted, n = >100. One-way ANOVA test was performed; (****) P < 0.0001. (F) Immunostaining showing G3BP1 localization after DMSO or selinexor (150 nM) treatment in B.1-infected cells (24 h postinfection). White arrow highlights some of the G3BP1 foci. Scale bar is 50 μm. (G) Immunostaining showing G3BP1 and m6A/YTHDF2 localization after selinexor treatment in B.1-infected cells (24 h postinfection). White arrow highlights some of the G3BP1 foci overlapping with either m6A or YTHDF2. Scale bar is 10 μm. (H) G3BP1 and YTHDF2 RIP showing enrichment of m6A-positive genes in Vero cells. IgG was used as a negative control. Statistics: two-tailed t-test; (***) P < 0.001, (****) P < 0.0001. n = 4. (I) G3BP1 and YTHDF2 RIP showing enrichment of m6A-positive genes in Vero cells treated with either METTL3 inhibitor STM2457 (5 μM) or DMSO. IgG was used as a negative control. Two-tailed t-test; (*) P < 0.05, (**) P < 0.01; n = 3. (J) Relative mRNA expression of genes with varying levels of m6A after selinexor treatment in B.1.1.7-infected cells. Treatment with selinexor partially restores the expression of m6A-modified genes (FAM111A, HDAC6, RNASEL, and PKHD1), but not the non-m6A gene (EID1). qPCR data were normalized to TBP and POL2RG. Statistics: two-tailed t-test; (*) P < 0.05, (**) P < 0.01, (***) P < 0.001, (****) P < 0.0001; n = 3. (K) m6A-RIP qPCR showing recovery of m6A levels at selected genes in selinexor-treated B.1.1.7-infected cells. DMSO was used as treatment control and IgG was used as a negative control for RIP. Two-tailed t-test; (*) P < 0.05, (**) P < 0.01, (***) P < 0.001, (****) P < 0.0001; n = 3.


