
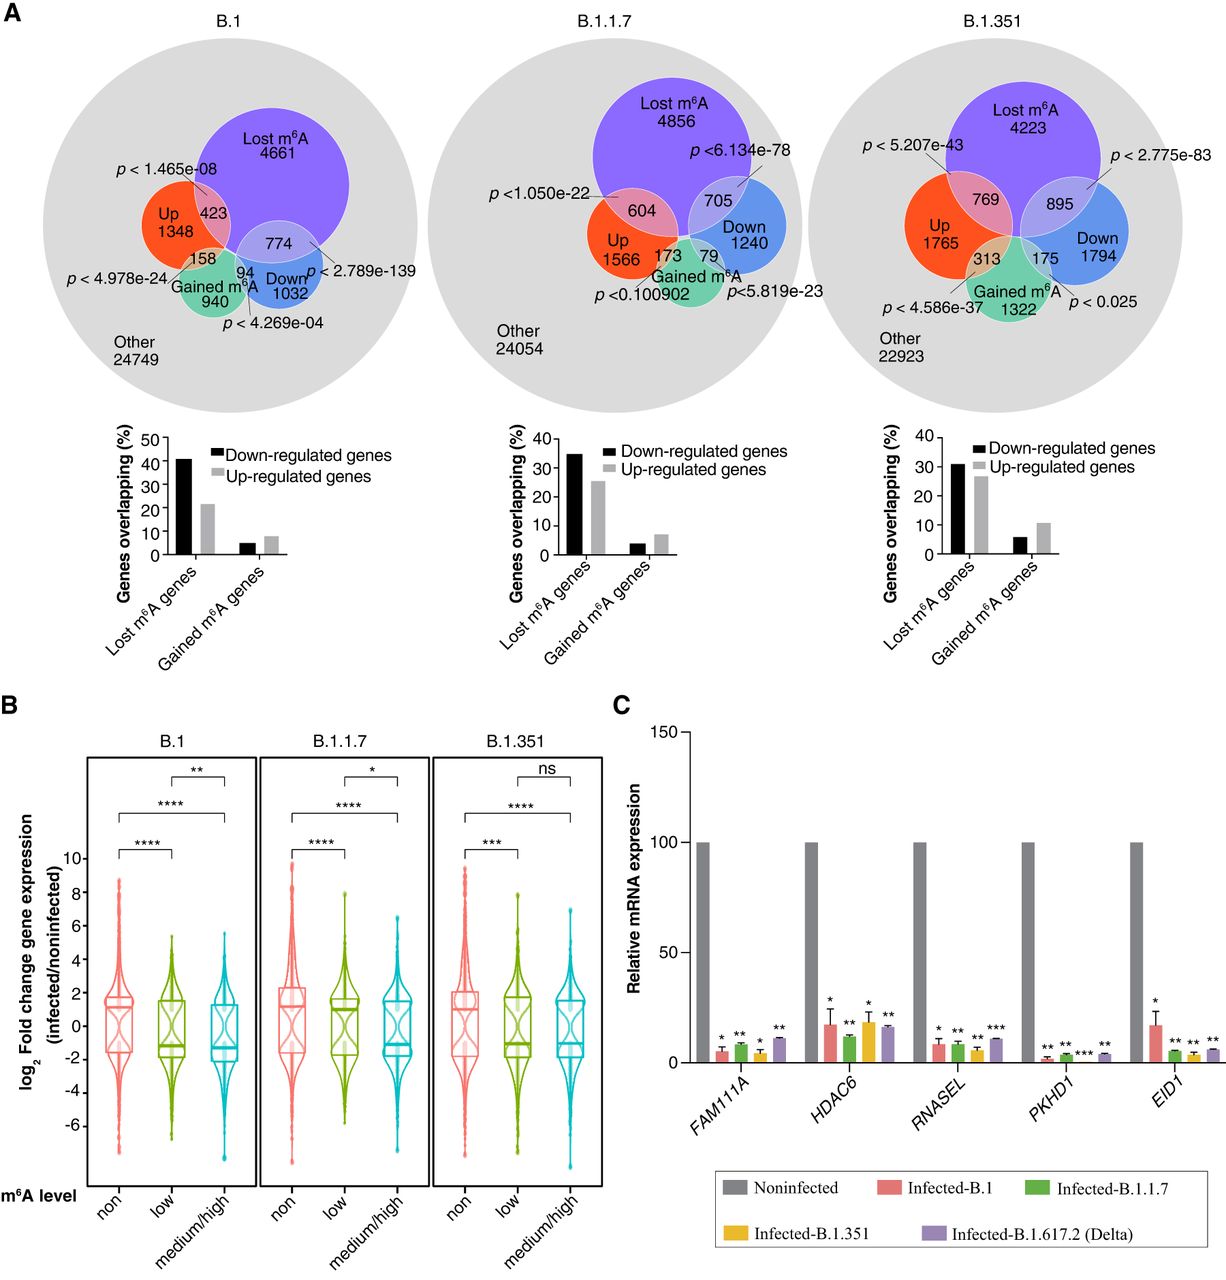
Gene expression after viral infection and global m6A loss. (A, top) Overlap diagrams of differentially expressed and m6A-modified genes after infection. Each set shows the number of up-regulated and down-regulated genes associated with lost or gained m6A modifications. The remaining genes are shown in gray. Hypergeometric test P-values depict the calculated probability of overlap between differentially expressed and m6A lost/gained genes. (A, bottom) Bar-graph summarizing the percentage of up-/down-regulated genes overlapping with either lost or gained m6A genes. (B) Log2 fold-change distributions of differentially expressed genes postinfection with three different variants, categorized according to their m6A level: non, low, medium/high. Statistical significance was calculated using the Wilcoxon test. (ns) Nonsignificant, (*) P < 0.05, (**) P < 0.01, (***) P < 0.001, (****) P < 0.0001. (C) Relative mRNA expression of genes with varying levels of m6A (FAM111A and PKHD1, high m6A; HDAC6, medium m6A; RNASEL, low m6A; EID1, no m6A) after viral infection with the variant indicated compared with noninfected cells. qPCR data were normalized to TBP and POL2RG. Statistics: two-tailed t-test; (*) P < 0.05, (**) P < 0.01, (***) P < 0.001, n = 2.


